Business Objectives and Pricing Decisions
Average Cost, Average Revenue and Profit
Average cost (AC): the cost of producing each unit, found by dividing total cost by output: \[ \text{AC} = \frac{\text{Total cost}}{\text{Quantity}} \]
Average revenue (AR): the revenue from each unit sold, found by dividing total revenue by output: \[ \text{AR} = \frac{\text{Total revenue}}{\text{Quantity}} \]
If every unit sells for the same price, AR is simply the price. That is why a firm's demand curve is also its AR curve.
Profit is total revenue minus total cost. It can also be found from the averages, as profit per unit times the number sold: \[ \text{Profit} = (\text{AR} - \text{AC}) \times \text{Quantity} \]
Marginal Cost and Marginal Revenue
Marginal cost (MC): the extra cost of producing one more unit: \[ \text{MC} = \frac{\text{Change in total cost}}{\text{Change in quantity}} \]
Marginal revenue (MR): the extra revenue from selling one more unit: \[ \text{MR} = \frac{\text{Change in total revenue}}{\text{Change in quantity}} \]
For most firms, selling more means cutting the price, and the lower price applies to every unit, not just the extra one. So MR is below the price and falls faster than AR.
Worked Example: A Furniture Maker
A workshop makes oak tables. To sell more each week it has to lower its price. Its fixed costs are £400 a week.
| Tables (Q) | Price = AR | TR | MR | TC | AC | MC | Profit |
|---|---|---|---|---|---|---|---|
| 1 | £400 | £400 | £400 | £500 | £500 | £100 | −£100 |
| 2 | £360 | £720 | £320 | £560 | £280 | £60 | £160 |
| 3 | £320 | £960 | £240 | £600 | £200 | £40 | £360 |
| 4 | £280 | £1,120 | £160 | £660 | £165 | £60 | £460 |
| 5 | £240 | £1,200 | £80 | £760 | £152 | £100 | £440 |
| 6 | £200 | £1,200 | £0 | £900 | £150 | £140 | £300 |
| 7 | £160 | £1,120 | −£80 | £1,120 | £160 | £220 | £0 |
Take the fourth table. TR rises from £960 to £1,120, so MR is £160. TC rises from £600 to £660, so MC is £60. Profit at 4 tables is £1,120 − £660 = £460, the same as (£280 − £165) × 4. That is the most the workshop can make, so its profit-maximising price is £280.
Marginal Cost, Marginal Revenue and Contribution
In unit 1.6.2, contribution per unit is the selling price minus variable cost per unit. Each unit's contribution goes towards fixed costs and then profit.
Marginal analysis is the same idea with a price that changes. Fixed costs don't change when one more unit is made, so MC is all variable cost. MR minus MC is therefore the contribution of the extra unit: what it adds to paying off fixed costs, and once they are covered, to profit.
- MR above MC: the extra unit makes a positive contribution → total contribution rises → profit rises, so the firm should produce it. The fourth table adds £160 − £60 = £100.
- MR below MC: the extra unit makes a negative contribution → total contribution falls → profit falls. The fifth table adds £80 − £100 = −£20, which is why profit drops from £460 to £440.
So total contribution, and profit, is at its highest where MC = MR. In unit 1.6.2 the price never changes, so every unit makes the same contribution. Here contribution shrinks with each unit because the price has to fall to sell more.
The Impact of Objectives on Pricing Strategies
A firm's price depends on what it is trying to achieve. The objectives themselves are in unit 1.1.2; here is what each means for price and output.
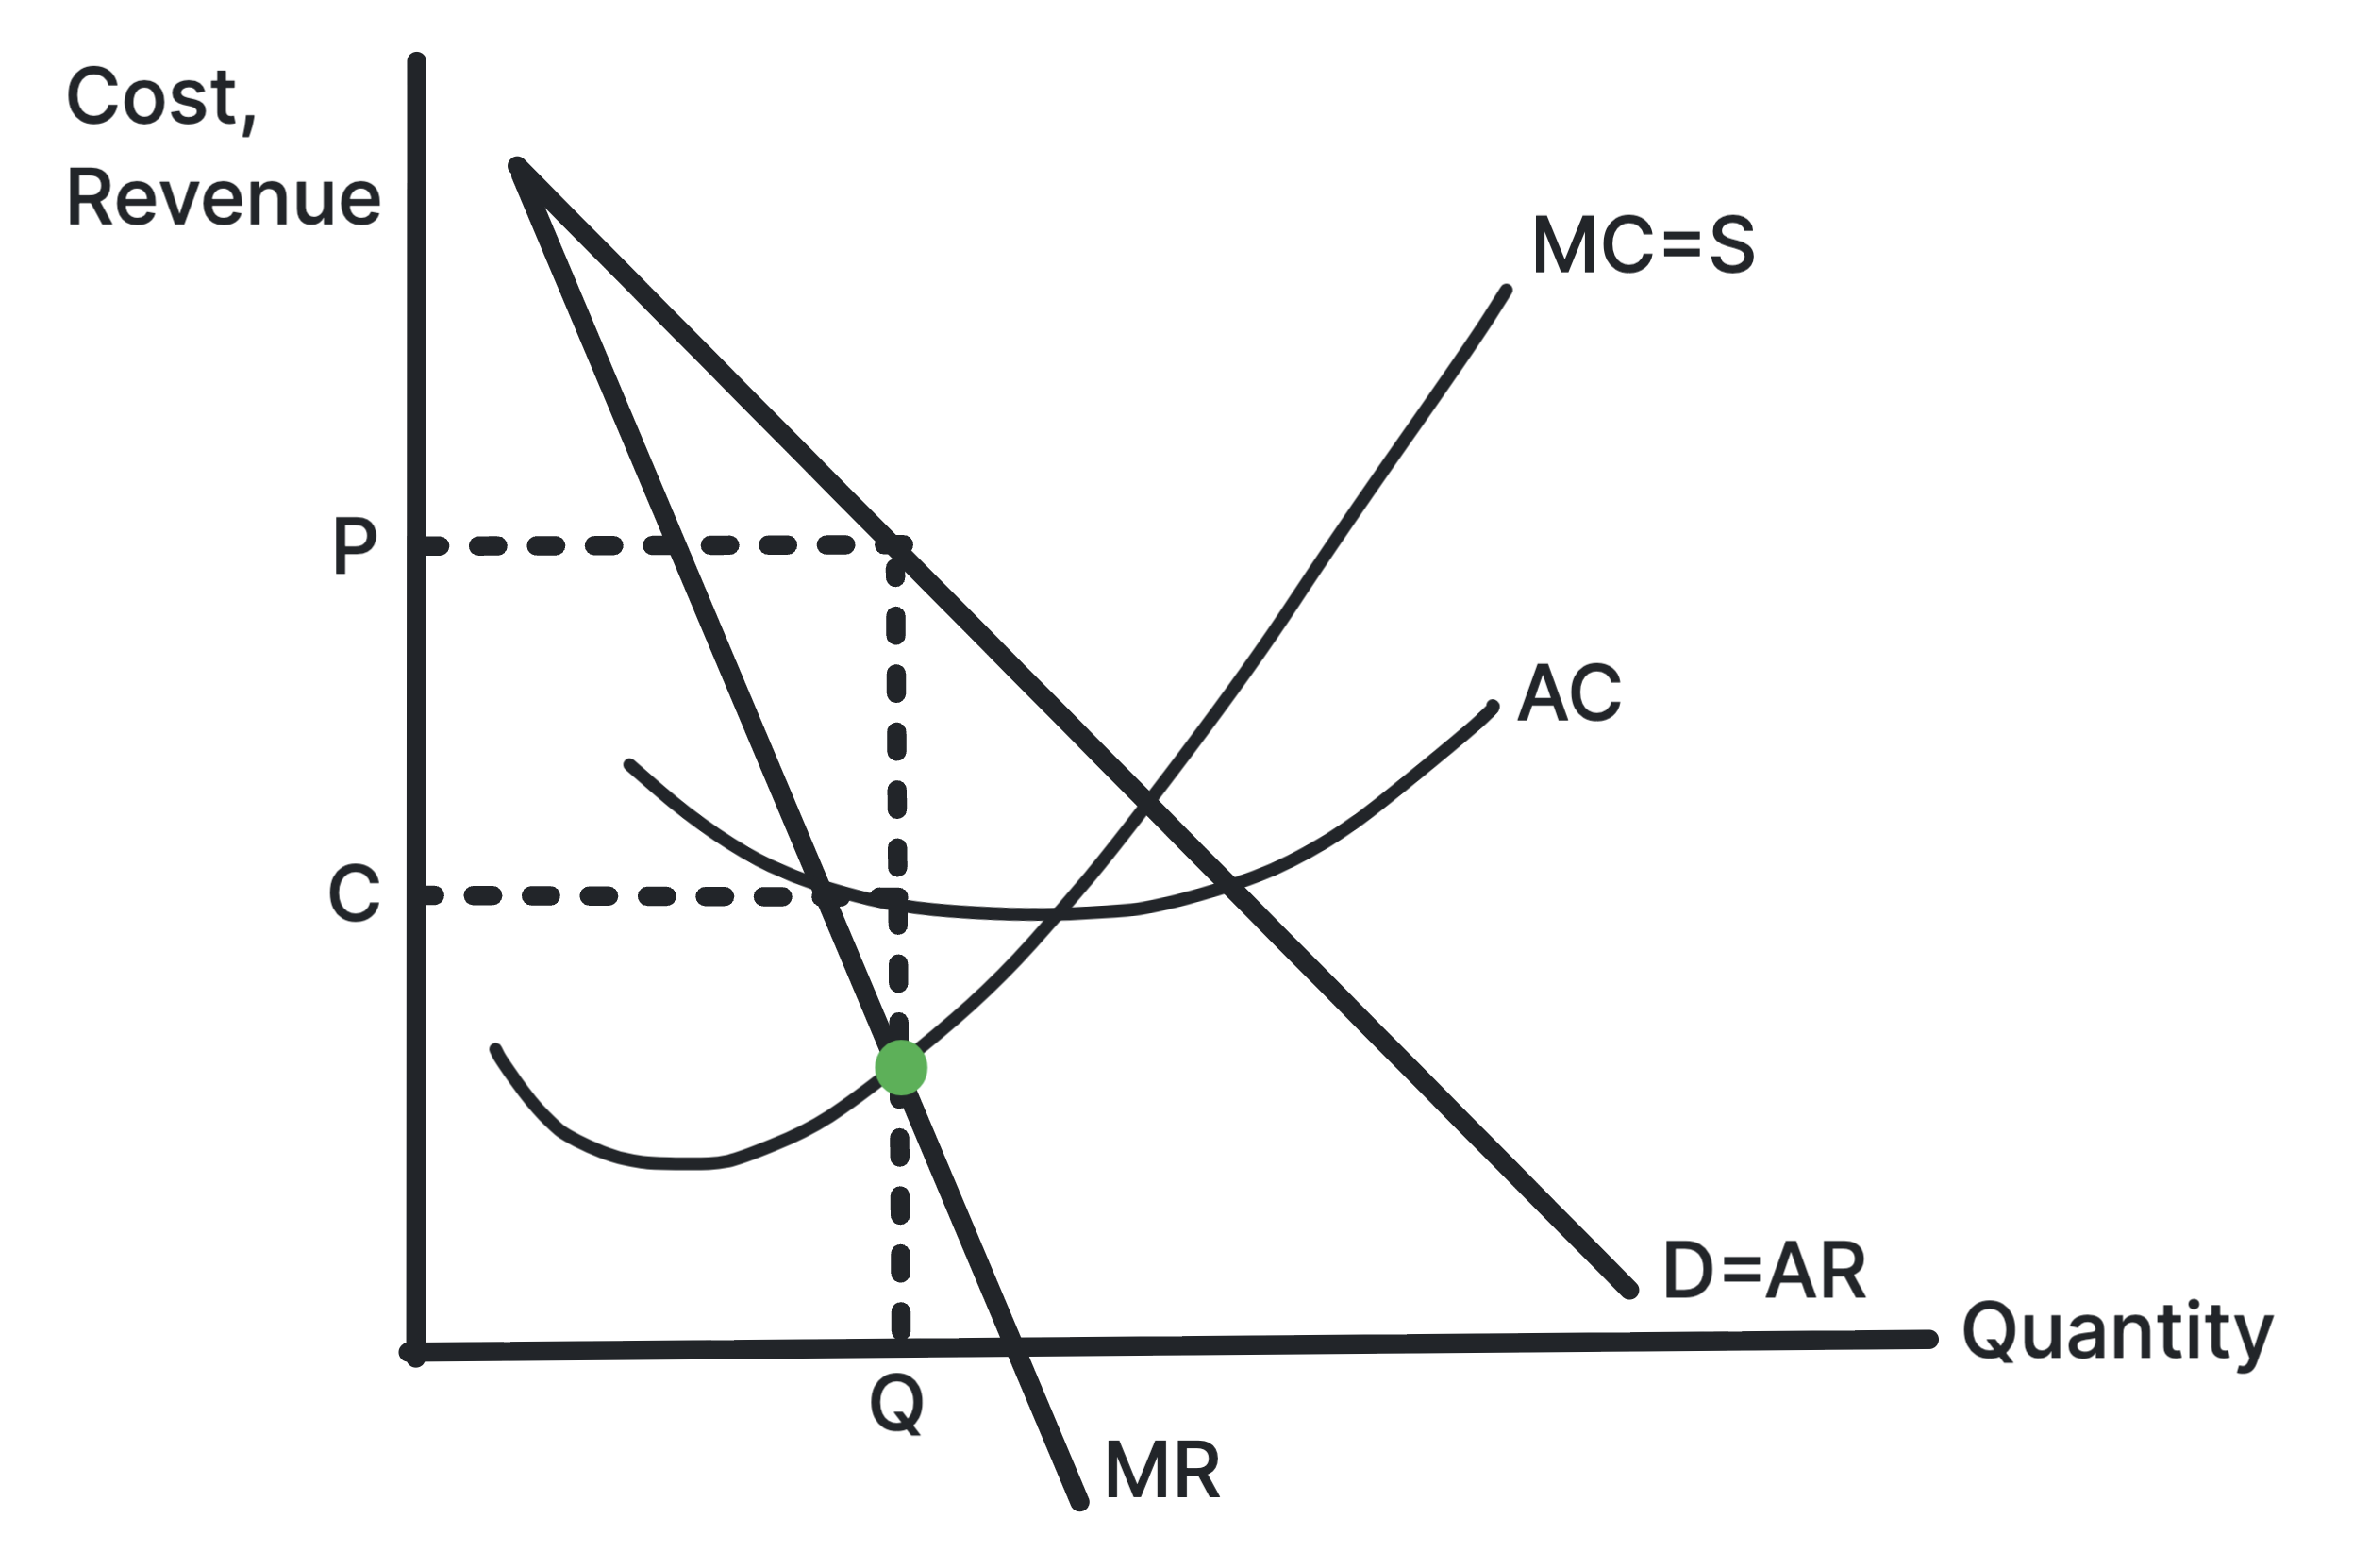
- Profit maximisation: produce where MC = MR → the highest price and the lowest output of the three → the most profit for the owners.
- Revenue maximisation: keep selling while each unit still adds revenue, so produce where MR = 0 → a lower price and more output → less profit, but a bigger business, which may suit managers paid on sales.
- Sales maximisation: sell as much as possible without making a loss, so produce where AR = AC → the lowest price and highest output → only normal profit, but more market share.
The furniture maker shows all three. Profit is highest at 4 tables, priced at £280. Revenue peaks at £1,200: the sixth table adds nothing (MR = £0), so a revenue maximiser makes 6 and charges £200. At 7 tables AR = AC = £160, so a sales maximiser charges £160 and just breaks even.
Other objectives lead to other pricing strategies:
- Satisficing: aiming for enough profit to keep the owners content → managers have room to pursue their own aims → price and output usually sit between the profit- and sales-maximising levels.
- Growth or market share: a low starting price wins customers from rivals → sales and market share rise → profit is lower now, in the hope of more later.
- Survival: in a downturn a firm may cut prices to keep cash coming in → as long as price covers variable cost, each sale still makes a contribution to fixed costs.
- Ethical or social aims: paying suppliers a fair price raises costs → the firm charges more, relying on customers who value its stance.
Which objective a firm follows, and so its price, depends on:
- Who runs it: owners usually want profit, while managers may prefer growth in sales, which brings them status and pay.
- Competition: a firm with close rivals has little room to price for anything but survival or market share.
- Its stage: a new firm may chase sales to get known, then switch to profit once it is established.
Profit is maximised where MC = MR, not where profit per unit is highest. In the worked example, profit per table (AR − AC) is highest at 3 tables (£120), but total profit is higher at 4 tables (£460 against £360). The fourth table lowers profit per unit but still adds £100. Always compare MR with MC for the next unit.
Stuck on this topic? Work through it with an online A-Level Economics tutor in a free 15-minute intro call, or send an essay on it for A-Level Economics essay marking.