Oligopoly
What Is an Oligopoly?
Oligopoly: a market dominated by a few large, interdependent firms, protected by high barriers to entry.
UK supermarkets, mobile networks and airlines are all oligopolies. Products may be identical, like petrol, or heavily branded, like soft drinks. What sets oligopoly apart is that each firm is big enough for its decisions to affect its rivals.
Concentration Ratios
Concentration ratio: the share of a market's total sales taken by its largest firms: \[ \text{n-firm concentration ratio} = \frac{\text{Sales of the largest n firms}}{\text{Total market sales}} \times 100 \]
A 4-firm ratio of 75% means the four biggest firms make three quarters of all sales. The higher the ratio, the more concentrated the market. A market is usually called an oligopoly when the top few firms hold most of it.
Worked Example: Coffee Shops in a City
Total coffee shop sales in a city are £50m a year. The four largest chains sell £15m, £12m, £8m and £5m.
| Ratio | Working | Answer |
|---|---|---|
| 2-firm | (£15m + £12m) ÷ £50m × 100 | 54% |
| 4-firm | (£15m + £12m + £8m + £5m) ÷ £50m × 100 | 80% |
Four chains share 80% of the market, leaving 20% for every independent café in the city. That is a concentrated market, and each chain will watch what the other three charge.
A concentration ratio has limits. A 4-firm ratio of 80% could be one giant and three small firms, or four equals. It also depends on how the market is drawn: a chain with a small share of UK coffee sales might dominate one town.
Interdependence and Price Stability
Interdependence: when each firm's sales and profit depend on what its rivals do, so it has to predict their reaction before it acts.
Interdependence explains why prices in an oligopoly tend to stay put. The kinked demand curve shows the reasoning from one firm's point of view:
- If it raises its price: rivals don't follow → customers switch to them → demand above the current price is price elastic → revenue falls.
- If it cuts its price: rivals match the cut so as not to lose customers → the firm gains few sales → demand below the current price is price inelastic → revenue falls.
Either way the firm loses, so it leaves its price where it is and competes in other ways, such as advertising, loyalty schemes and new products (non-price competition, unit 4.1.1).
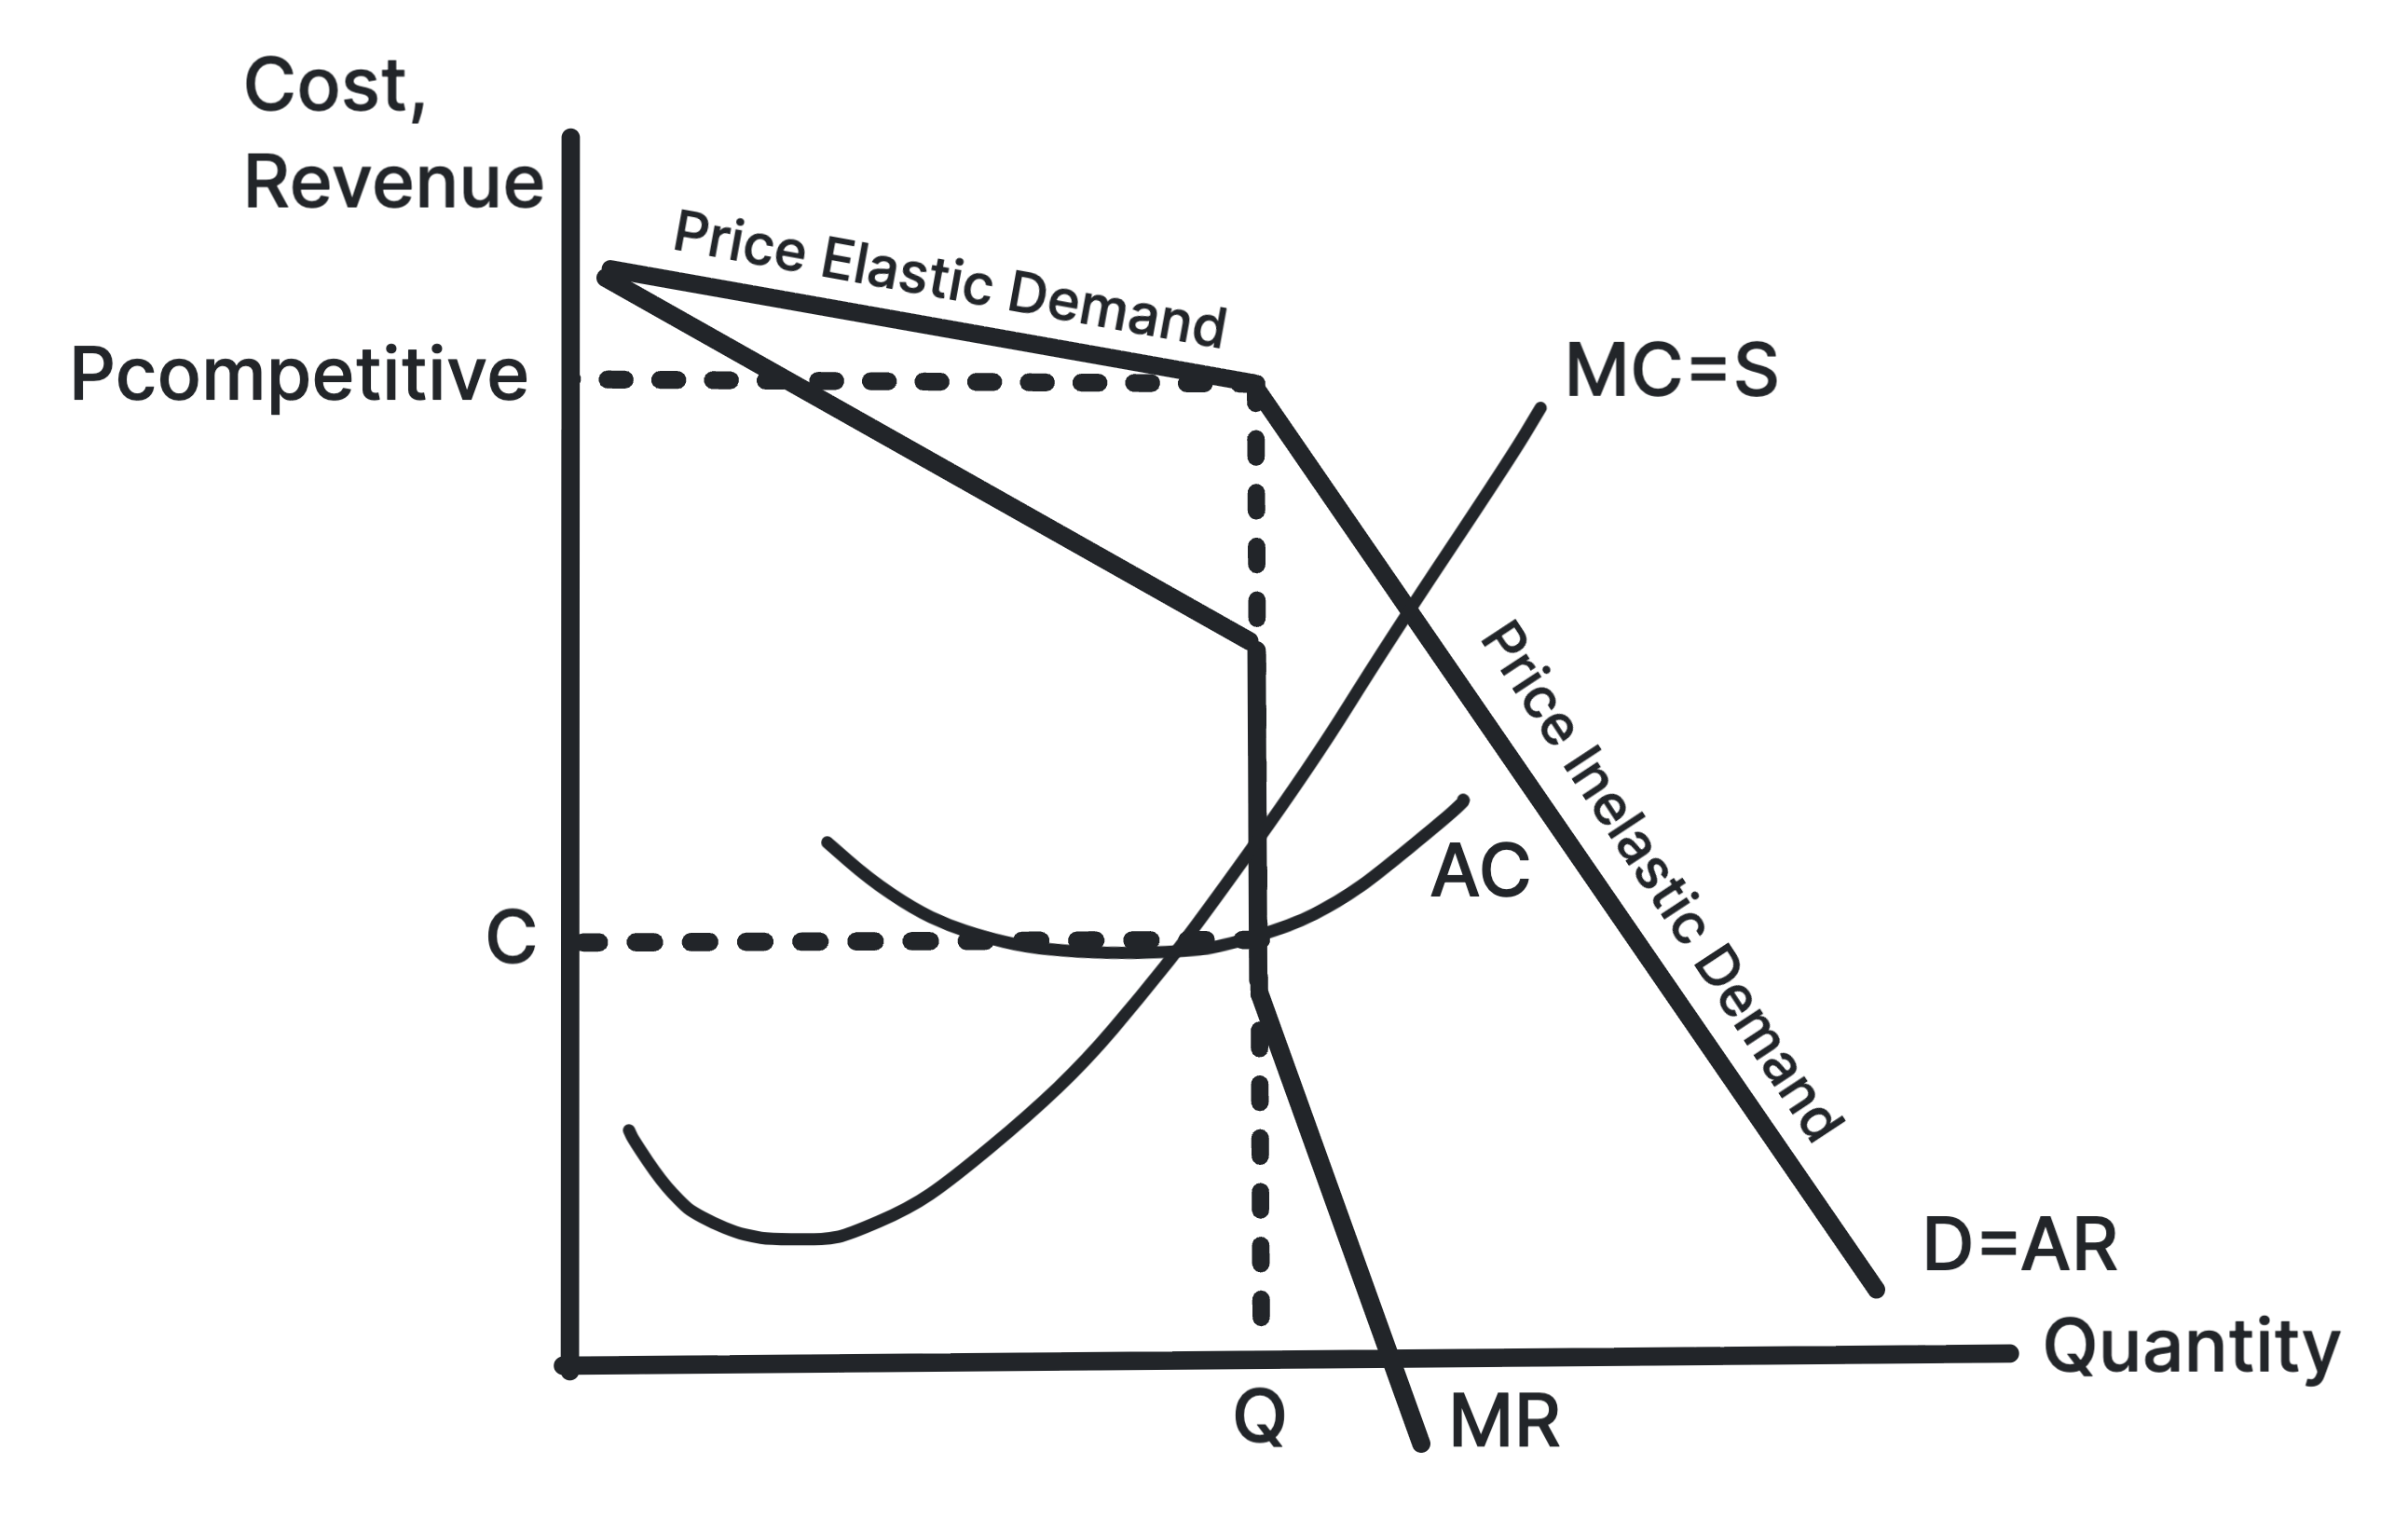
The gap in the MR curve adds a second reason for stable prices. A firm maximises profit where MC = MR, and MC can move up or down inside the gap with no change in the best price. So even a change in costs may leave prices unchanged.
Stability can break down. A firm with much lower costs, or a new entrant, may cut prices to win market share, and rivals follow in a price war: consumers gain from lower prices for a while → every firm's revenue and profit fall → weaker firms may leave the market.
A Simple Payoff Matrix
Interdependence can also be shown with a payoff matrix. Two bus companies on the same route each choose a high or a low fare. Each cell shows yearly profit as (Company A, Company B):
| B: high fare | B: low fare | |
|---|---|---|
| A: high fare | £10m, £10m | £3m, £13m |
| A: low fare | £13m, £3m | £6m, £6m |
Whatever B does, A earns more by charging the low fare (£13m beats £10m, and £6m beats £3m), and the same is true for B. So both choose low fares and earn £6m each, though both would earn £10m if they kept fares high. That is the pull towards an agreement, covered next.
Tacit Agreement
Tacit agreement: firms coordinating their prices or output without any formal or spoken agreement, for example by following a price leader.
An open agreement to fix prices, a cartel, is illegal in the UK (unit 4.2.1). A tacit agreement has no meeting or contract: the largest firm raises its price and the others follow, or firms learn that price cuts only start price wars. The result can match a cartel's, but it is much harder to prove.
- Firms: prices stay above the competitive level → higher margins → supernormal profit.
- Consumers: prices are higher than with real competition → consumers pay more and buy less → lower real incomes.
A tacit agreement is more likely to hold when:
- There are very few firms: it is easier to watch each other and spot a rival cutting prices.
- Products and costs are similar: firms want roughly the same price, so there is less to disagree about.
- Barriers to entry are high: no newcomer can undercut the high prices.
- Demand is stable: in a downturn, the pull to cut prices and win sales grows stronger.
Price Discrimination
Price discrimination: charging different customers different prices for the same product, where the difference is not caused by a difference in cost.
There are three degrees:
- First-degree: each customer pays the most they are willing to pay, as when a price is haggled over or set by auction.
- Second-degree: the price depends on how much is bought, such as a lower price per unit for bulk orders.
- Third-degree: different groups of customers pay different prices, such as peak and off-peak rail fares.
The rest of this section is about third-degree price discrimination. Student cinema tickets and cheaper children's haircuts are other everyday examples. A firm needs three conditions:
- Market power: it must be able to set prices, which a price taker cannot.
- Groups with different PED: it must be able to tell apart customers who will pay more from those who will not.
- Separate markets: it must stop customers who pay the low price reselling to those charged the high one, for example by checking a student card or tying the ticket to a time.
The firm charges a higher price where demand is price inelastic and a lower one where it is price elastic. Commuters have to travel at peak times, so their demand is inelastic and they pay more. Leisure travellers can choose another time or not go, so they get a lower fare.
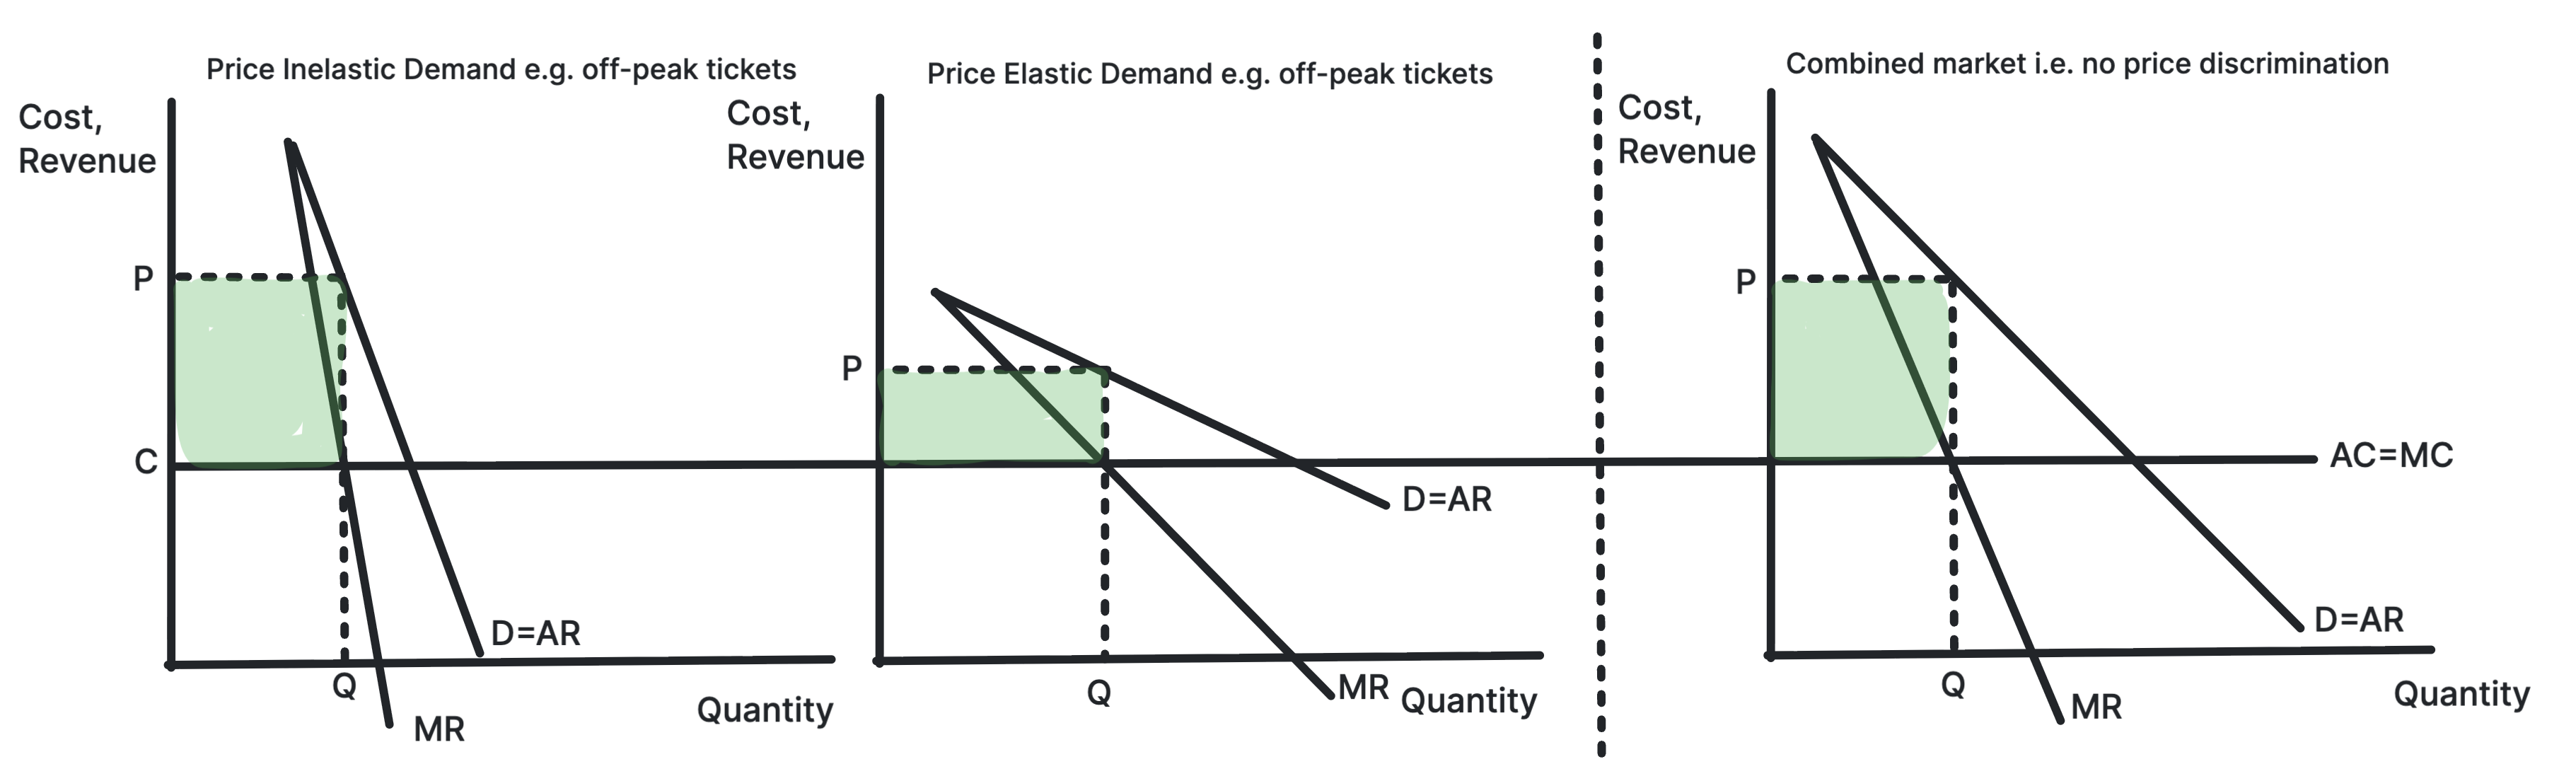
- The firm: each group pays closer to the most it is willing to pay → more consumer surplus becomes revenue → higher profit than one single price.
- Customers with inelastic demand: charged more than a single price → they lose consumer surplus.
- Customers with elastic demand: charged less → some can now afford the product, such as students going to the cinema.
Whether price discrimination is good or bad depends on:
- Use of the extra profit: it may pay for investment, or keep a service running that would otherwise close, such as a lightly used rail route.
- Who pays more: it is harder to defend if the high price falls on people on low incomes with no choice.
- Use of capacity: cheap off-peak fares fill seats that would otherwise be empty, at very little extra cost.
Use a payoff matrix to explain behaviour, not just to read numbers. Find each firm's best choice for every move its rival could make, then explain the outcome: both end up worse off than if they had trusted each other. That is why firms are tempted into tacit agreements, and why those agreements break down.
Stuck on this topic? Work through it with an online A-Level Economics tutor in a free 15-minute intro call, or send an essay on it for A-Level Economics essay marking.