Break-Even Analysis
Contribution
Break-even analysis asks a simple question: how many units does a business have to sell before it stops losing money? The answer starts with contribution.
Contribution per unit: the selling price of one unit minus its variable cost: \[ \text{Contribution per unit} = \text{Selling price} - \text{Variable cost per unit} \]
Contribution is what is left from each sale once its variable cost is paid. It goes towards the fixed costs, and once they are covered, the contribution from every further unit is profit.
Total contribution is contribution per unit times sales volume, which is the same as total revenue minus total variable costs. Take fixed costs away from total contribution and you have profit.
The Break-Even Point
Break-even point: the level of output at which total revenue equals total costs, so the business makes neither a profit nor a loss. At that output, total fixed costs + total variable costs = total sales revenue.
Below the break-even point, revenue does not cover costs and the business makes a loss. Above it, the business makes a profit.
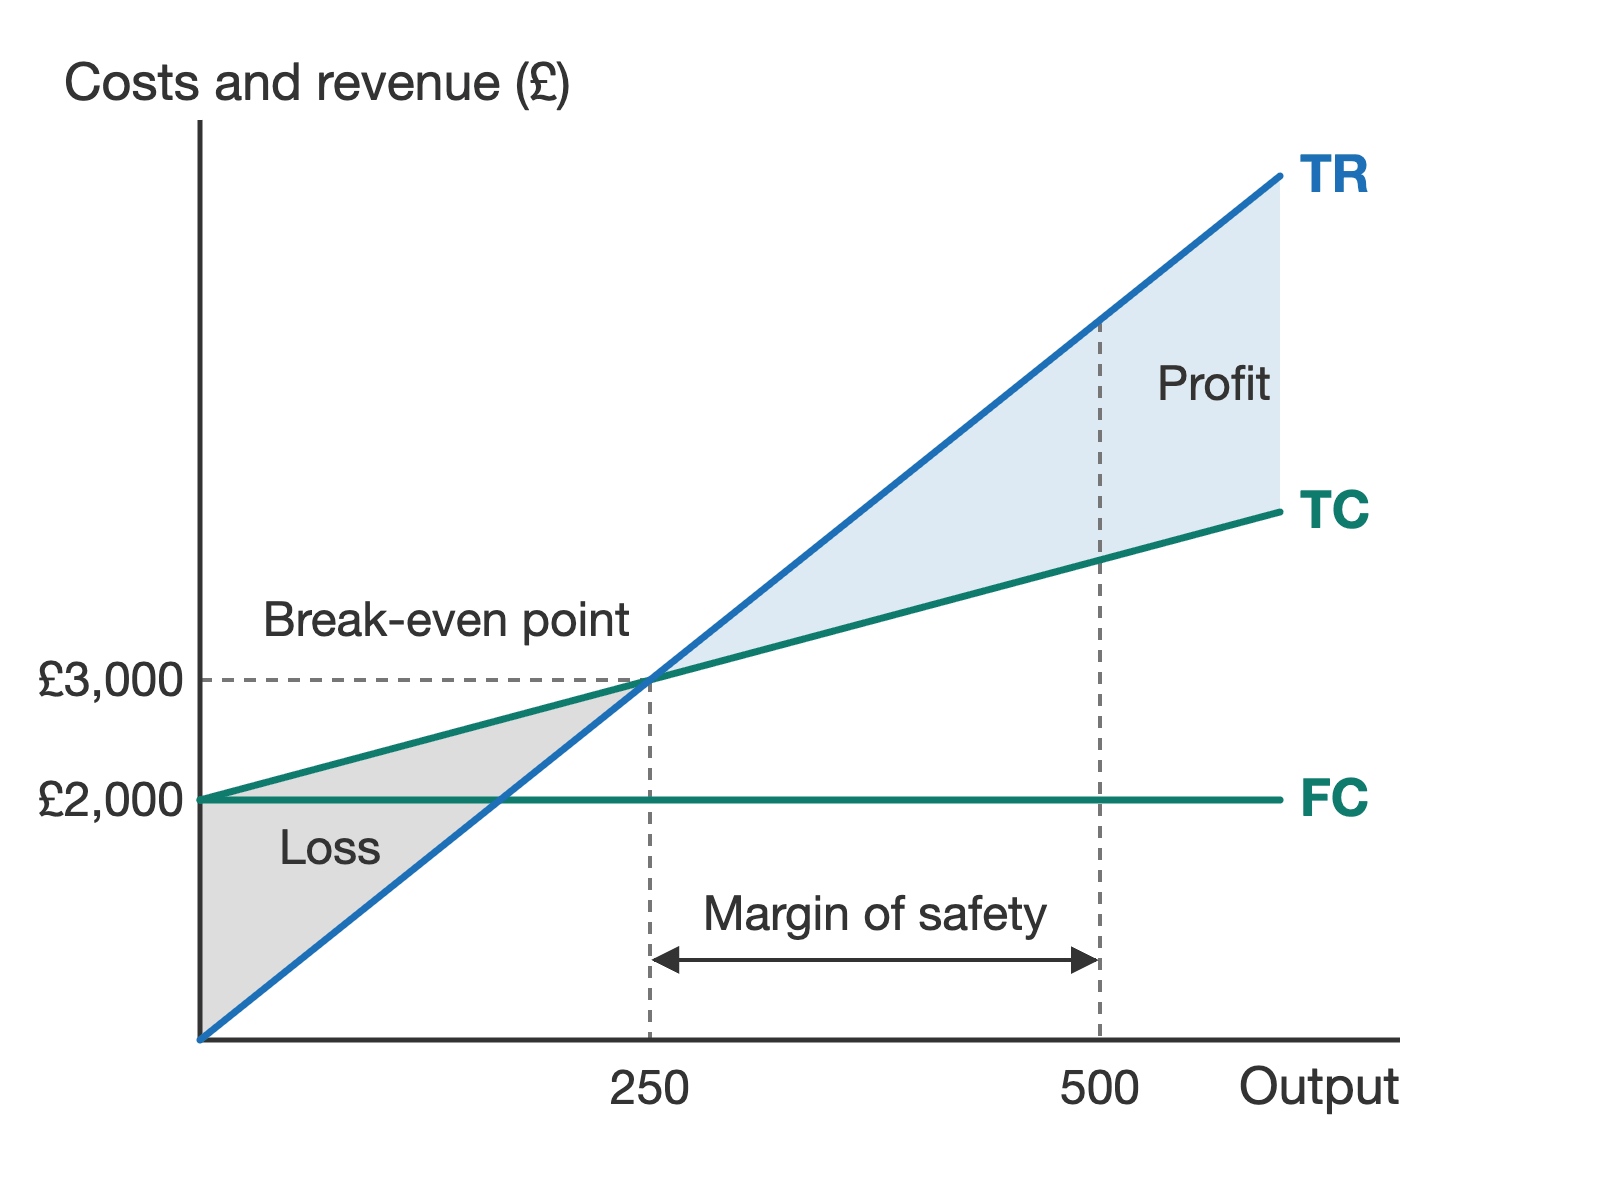
A break-even chart shows this on one diagram, with output along the bottom and costs and revenue up the side. Fixed costs are a horizontal line. Total costs start at the fixed cost line, because some costs are paid even at zero output, and rise with each unit made. Total revenue starts at zero and rises more steeply than total costs, because each unit sells for more than its variable cost. The break-even point is where the total revenue and total cost lines cross. The gap between them to the left is a loss, and to the right a profit.
Using Contribution to Find the Break-Even Point
Since each unit contributes the same amount towards fixed costs, the business breaks even once total contribution equals fixed costs. So:
\[ \text{Break-even output} = \frac{\text{Total fixed costs}}{\text{Contribution per unit}} \]
The answer is a number of units. To find the sales revenue needed to break even, multiply break-even output by the selling price. If the answer is not a whole number, round up: a business cannot sell part of a unit, and rounding down would leave it just short.
Margin of Safety
Margin of safety: the amount by which actual or planned sales are above the break-even point: \[ \text{Margin of safety} = \text{Actual output} - \text{Break-even output} \]
It tells a business how far sales could fall before it makes a loss, in units or as a percentage of actual sales. A large margin means the business could survive a drop in demand; a small one means even a short dip would push it into loss.
Worked Example: Rosa's Candles
Rosa sells scented candles for £12 each. Each one costs £4 in materials, and her fixed costs are £2,000 a month. She sells 500 candles a month.
| Step | Working | Answer |
|---|---|---|
| Contribution per unit | £12 − £4 | £8 |
| Break-even output | £2,000 ÷ £8 | 250 candles |
| Break-even revenue | 250 × £12 | £3,000 |
| Margin of safety | 500 − 250 | 250 candles (50% of sales) |
| Profit | 250 × £8 | £2,000 |
Profit is the contribution from the 250 candles sold beyond break-even. As a check, revenue of 500 × £12 = £6,000 minus total costs of £2,000 + (500 × £4) = £4,000 also gives £2,000. Rosa's sales could halve before she made a loss, which is a comfortable position for a small business.
What Moves the Break-Even Point
Change any of the three figures and the break-even point moves. Using Rosa's numbers:
- She raises her price to £14 → contribution rises to £10 → break-even falls to 2,000 ÷ 10 = 200 candles → if she still sells 500, her margin of safety grows from 250 to 300. Whether she is better off depends on how many customers she loses.
- Her materials cost more, say £6 a candle → contribution falls to £6 → break-even rises to 2,000 ÷ 6 = 333.3, so 334 candles → her margin of safety shrinks to 166.
- Her rent goes up and fixed costs reach £2,400 → break-even rises to 2,400 ÷ 8 = 300 candles → her margin of safety shrinks to 200.
Limitations of Break-Even Analysis
Break-even analysis is quick and easy to understand. A new business can use it to set a sales target, and banks often expect to see it in a business plan before lending (see unit 1.4.3). But it rests on assumptions that rarely hold exactly.
- It assumes every unit made is sold. In practice some stock goes unsold, is wasted or has to be sold off cheaply.
- It assumes one selling price. Many firms offer discounts for bulk orders, run sales or charge different customers different prices.
- It assumes variable cost per unit stays the same. Buying materials in bulk can bring the cost of each unit down, while overtime pay can push it up. Either way, the lines on the chart would no longer be straight.
- It assumes fixed costs stay fixed. Beyond a certain output the firm needs more space or equipment, and fixed costs jump.
- It is harder to use for a business selling many products, because the fixed costs have to be shared out between them, and any way of doing that is partly guesswork.
- It is only as good as the figures put into it. A forecast of sales or costs that turns out to be wrong gives a misleading break-even point, and it says nothing about whether customers will want the product at all.
Divide fixed costs by contribution, not by the selling price. Using Rosa's figures, £2,000 ÷ £12 gives 167 candles, which ignores the £4 each candle costs to make. The right answer is £2,000 ÷ £8 = 250 candles. Remember too that this gives a number of units; multiply by the price if the question asks for break-even revenue.
Stuck on this topic? Work through it with an online A-Level Economics tutor in a free 15-minute intro call, or send an essay on it for A-Level Economics essay marking.