Circular Flow of Income, Expenditure and Output
The Circular Flow of Income
Circular flow of income: a model of how money moves round an economy, from firms to households as income and back to firms as spending.
Households own the factors of production: land, labour, capital and enterprise. Firms hire them and pay for them with income: rent, wages, interest and profit. Households spend that income on firms' goods and services, and firms use the revenue to pay for factors again.
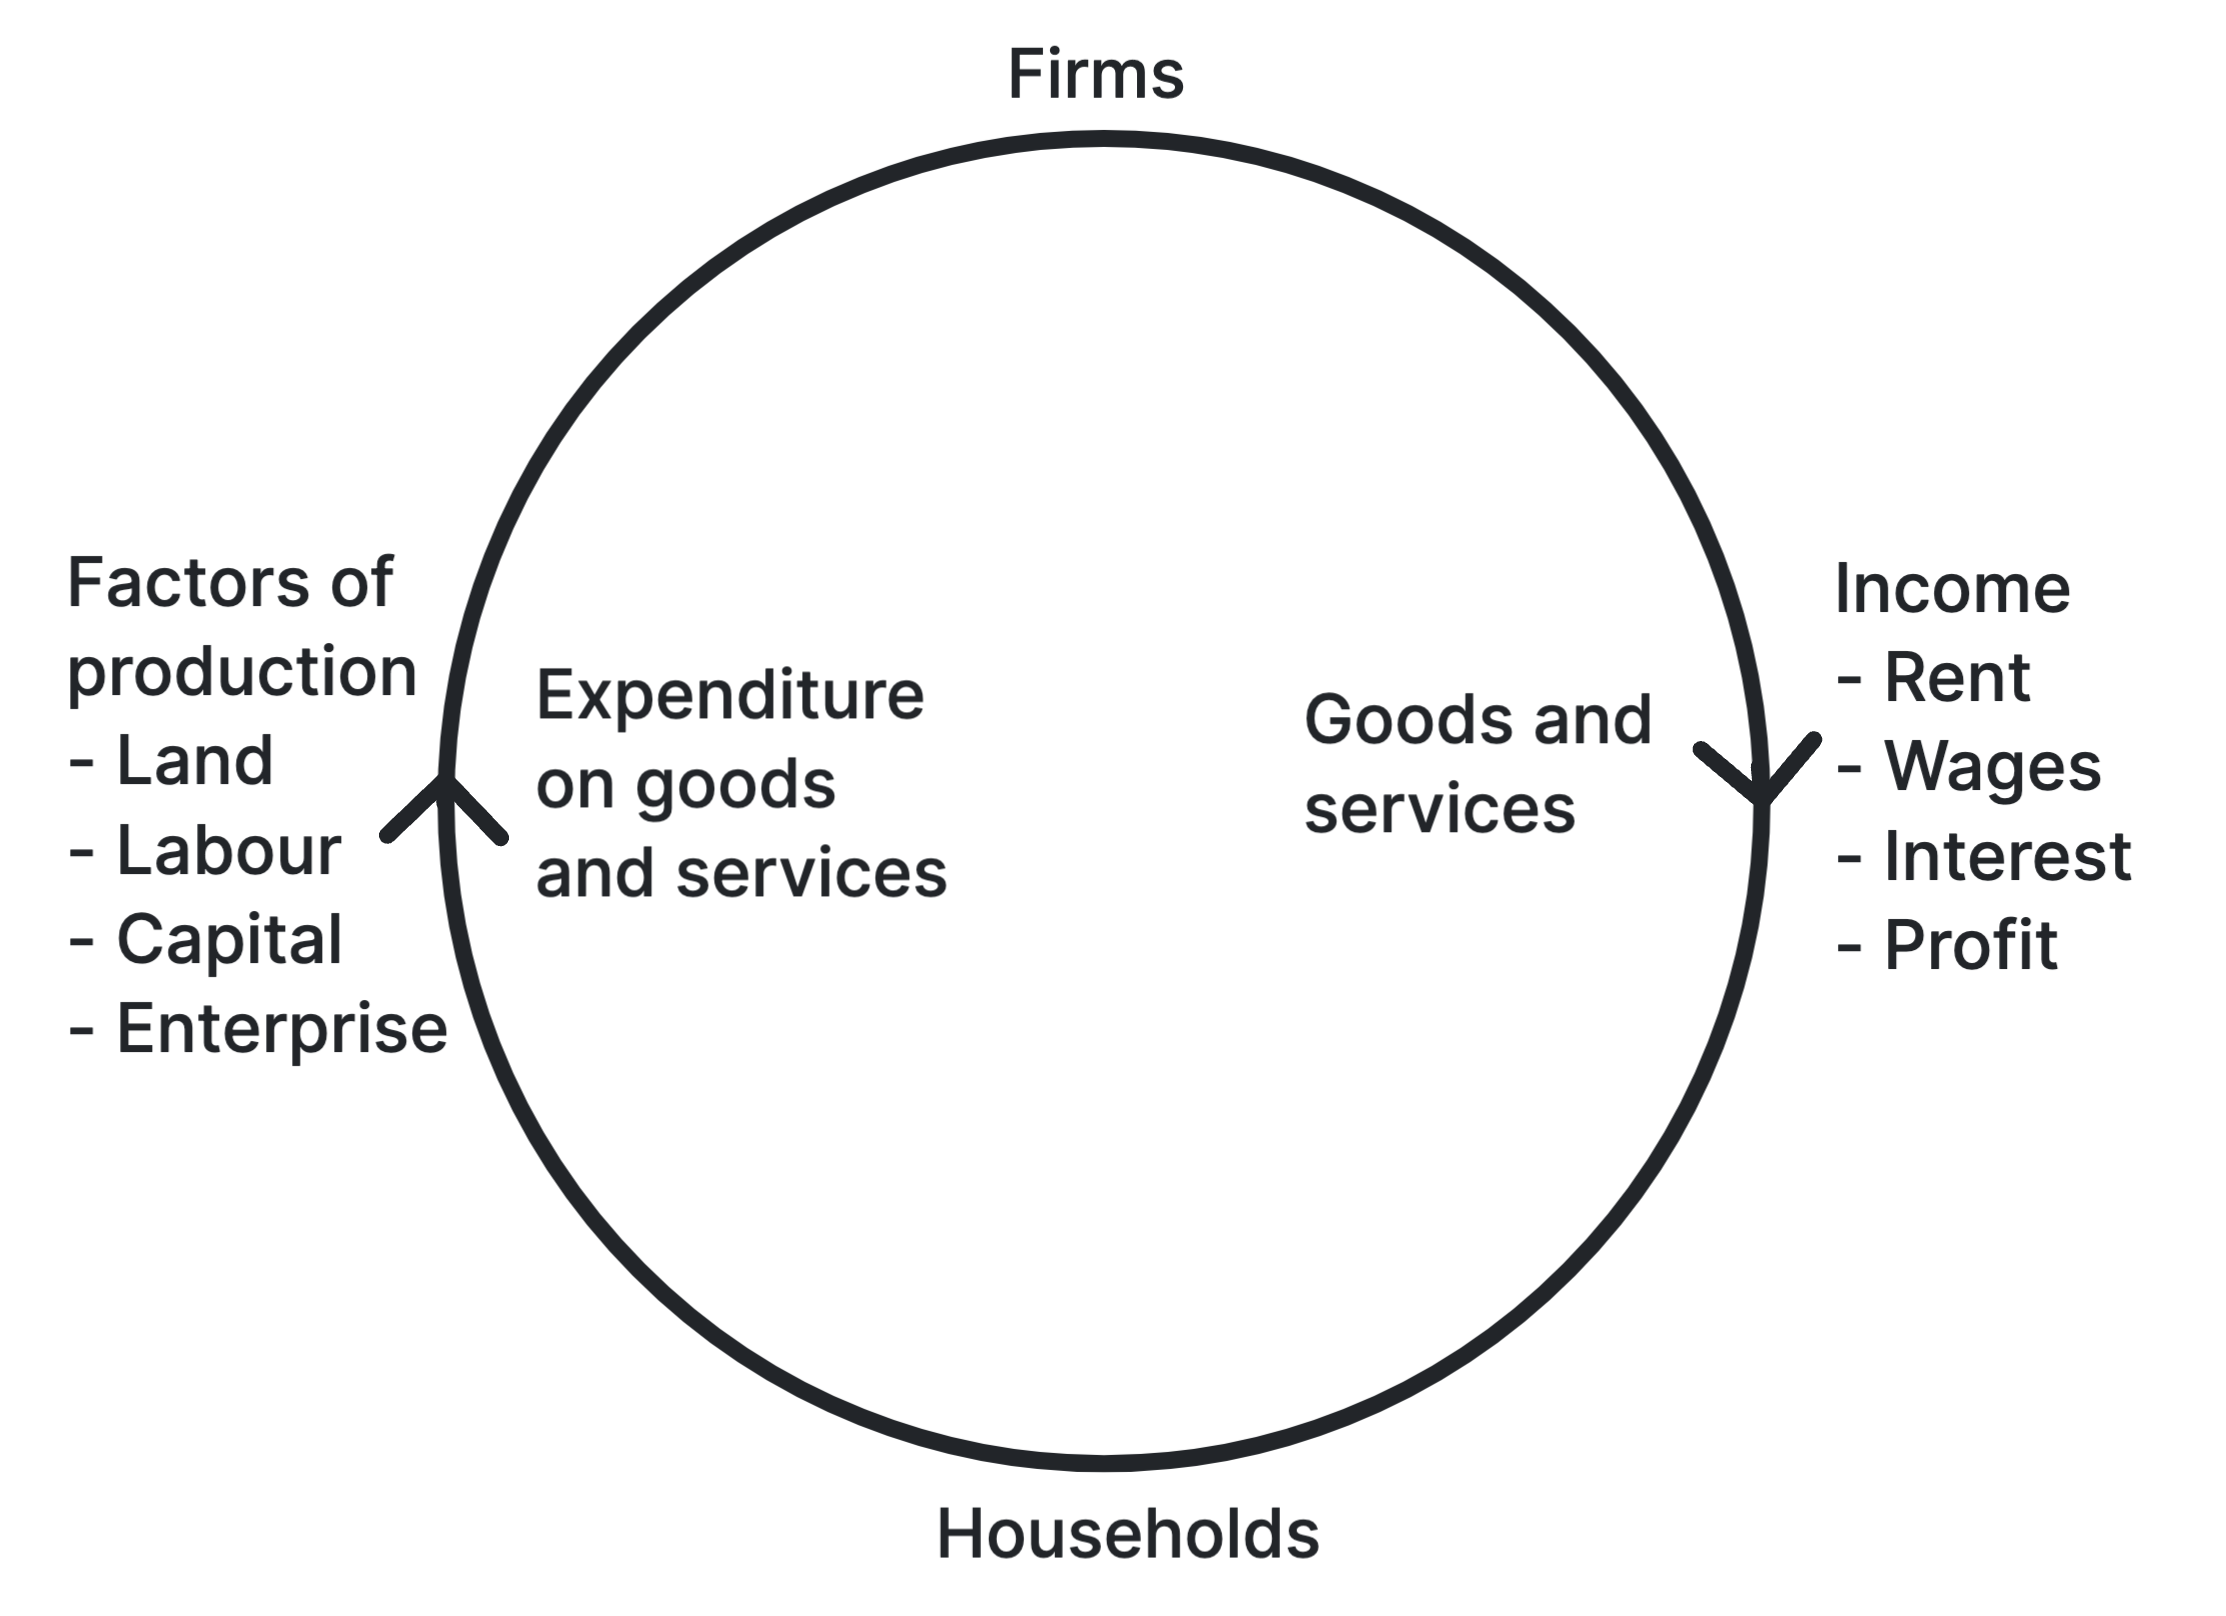
The flow can be measured at three points, and in theory they give the same answer:
- Output: the value of all the goods and services firms produce.
- Income: everything paid to the owners of the factors that produced them.
- Expenditure: everything spent on buying them.
They match because every pound spent on a product is a pound of income for whoever helped make it. Each is a way of measuring national income, the size of the economy.
Injections and Withdrawals
In a real economy, not all income is spent on UK goods, and not all spending comes from UK households' incomes.
Injection: spending that enters the circular flow from outside the household-firm loop: investment, government spending and exports.
Withdrawal: income that leaves the circular flow instead of being spent on the country's own output: saving, taxation and imports. Withdrawals are also called leakages.
| Sector | Injection | Withdrawal |
|---|---|---|
| Financial | Investment (I): firms spending on machinery, buildings and equipment | Saving (S): income households put aside instead of spending |
| Government | Government spending (G): on public services such as schools, hospitals and roads | Taxation (T): income tax, VAT and other taxes paid to the government |
| Overseas | Exports (X): spending by foreign buyers on UK goods and services | Imports (M): spending by UK buyers on goods and services from abroad |
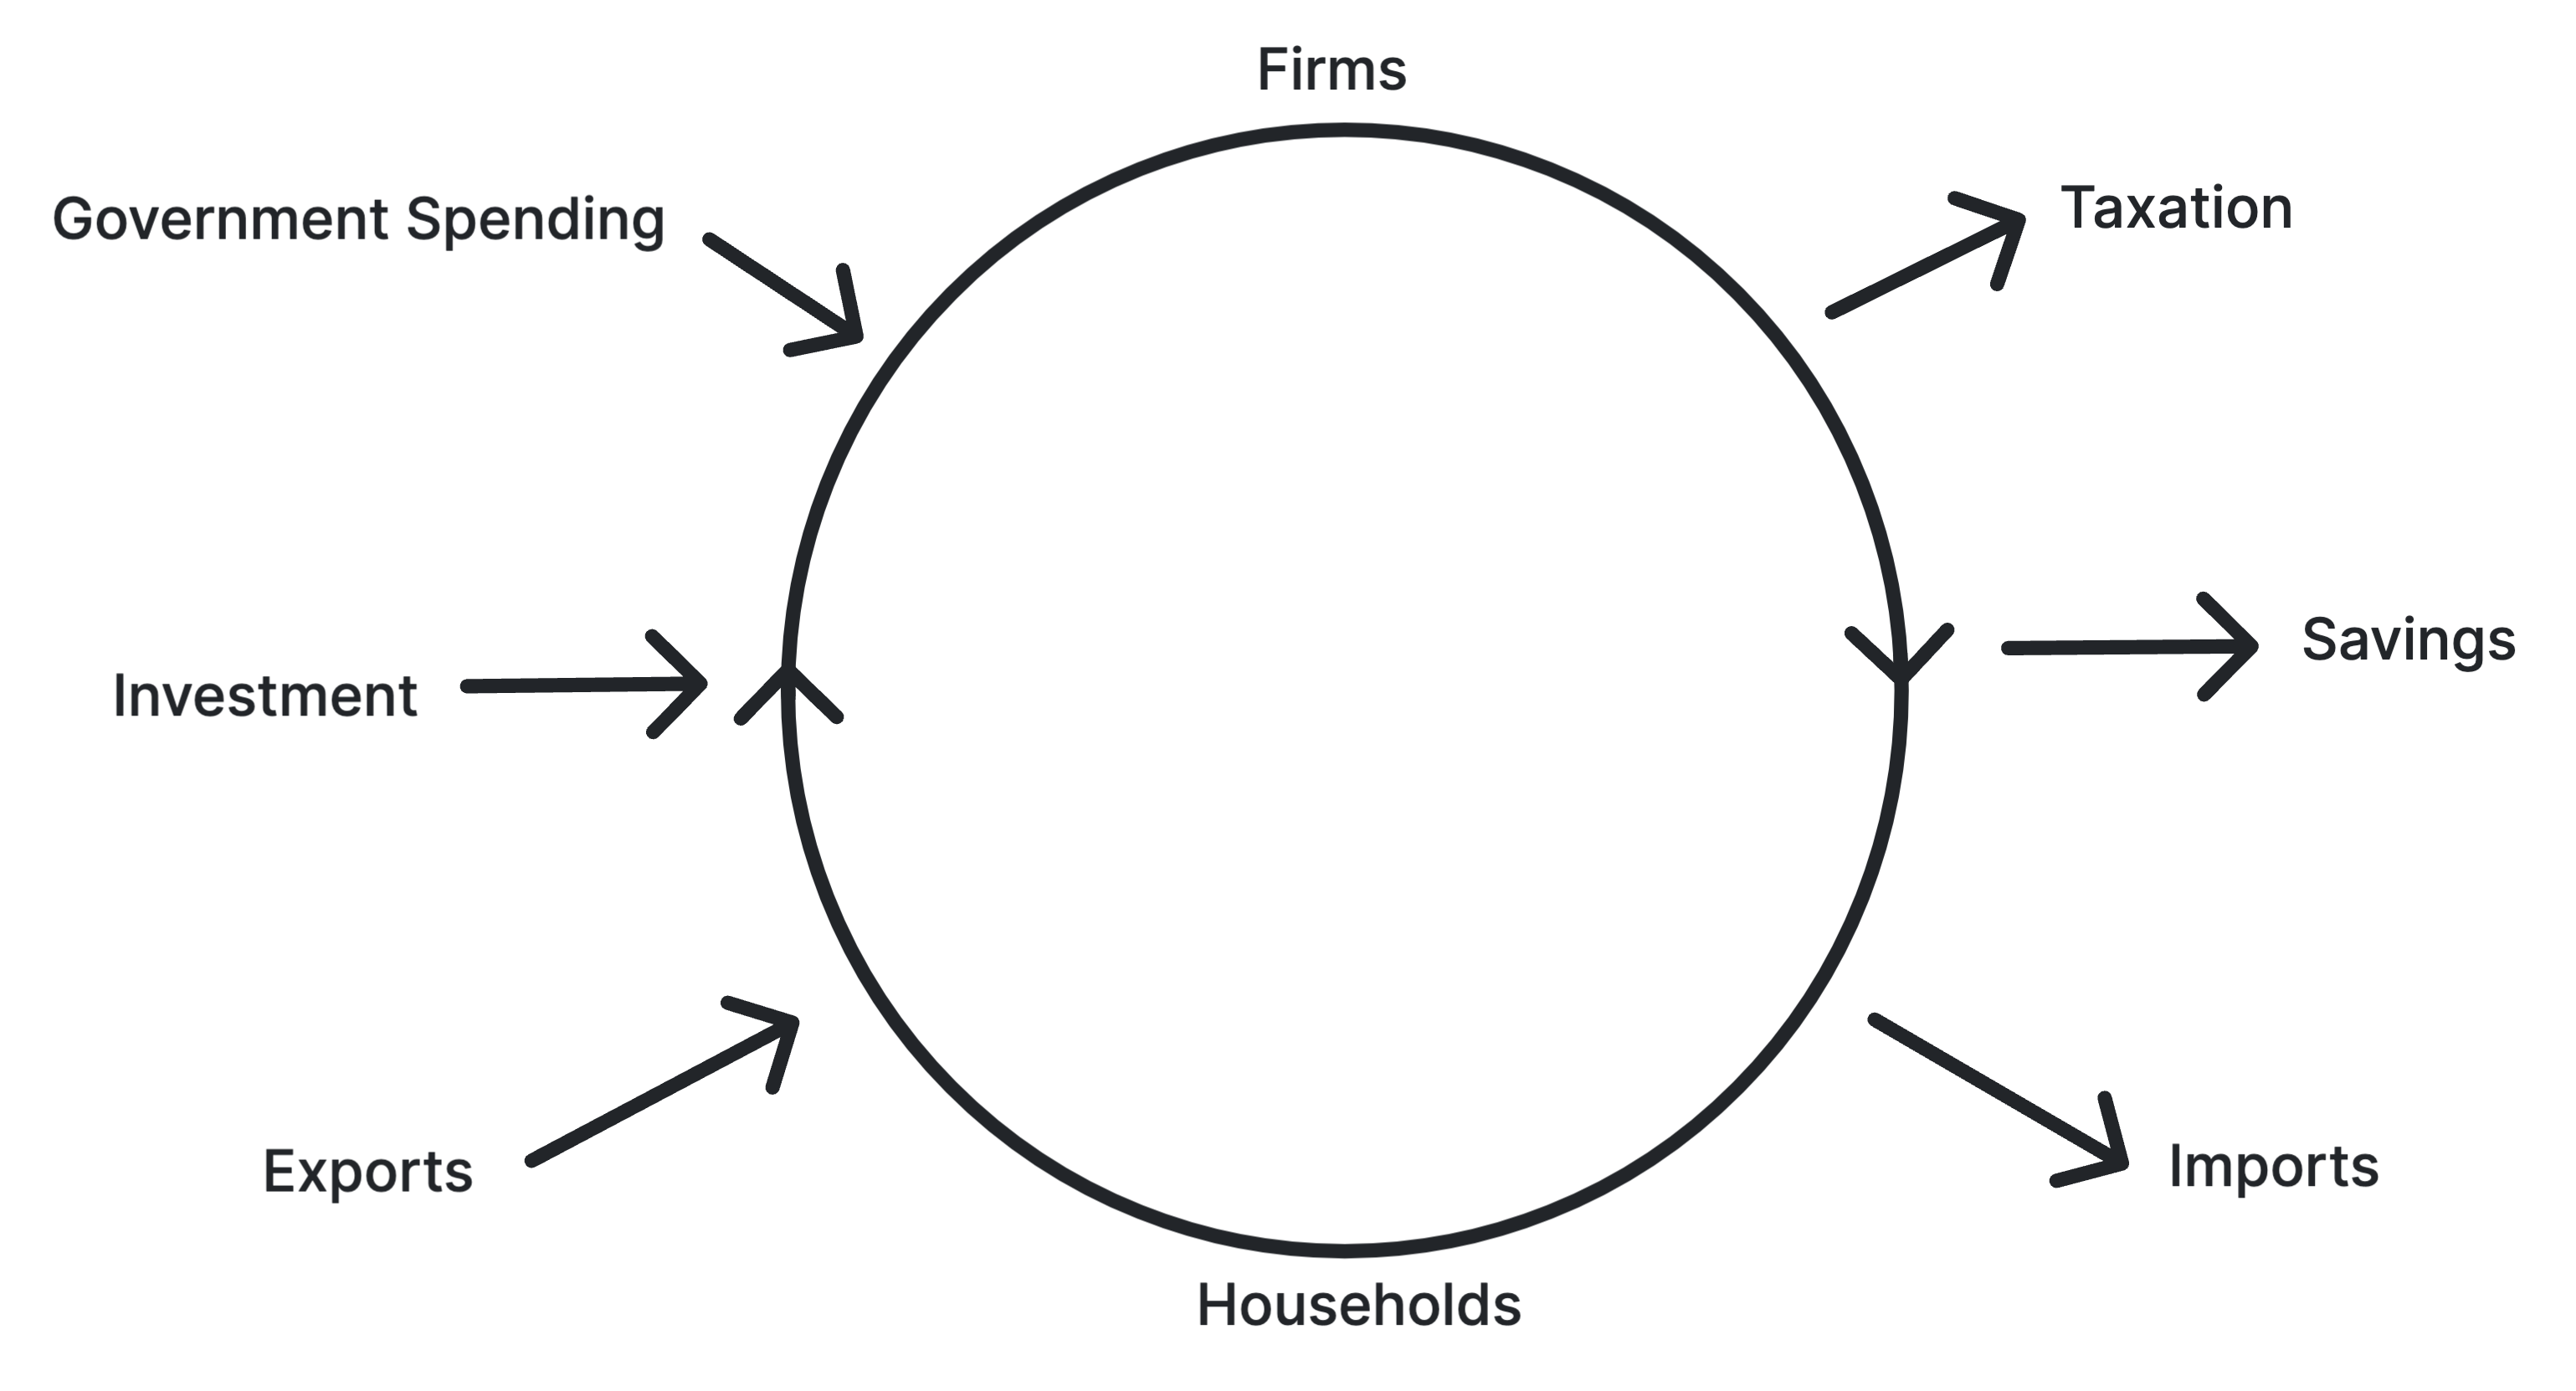
The flow is stable, in equilibrium, when injections equal withdrawals: \[ I + G + X = S + T + M \]
When injections rise above withdrawals:
- The flow grows: for example, foreign demand for UK goods rises → exporters sell more → they take on staff and pay more in wages → those workers spend more in UK shops → sales, output and jobs rise across the economy.
When withdrawals rise above injections:
- The flow shrinks: for example, worried households save more → less is spent in shops → firms sell less and cut output and jobs → incomes fall, so spending falls again.
Each round of spending becomes someone else's income, so the final change in national income is bigger than the first one. This is the multiplier effect (unit 4.4.1).
The size of the impact depends on:
- Spare capacity: with idle workers and machines, extra spending raises output and jobs; near full capacity it mostly raises prices.
- Where withdrawals go next: banks lend savings on to firms to invest, and taxes pay for government spending, so a withdrawal can come back in as an injection.
Factors Influencing Aggregate Demand
Aggregate demand (AD): total planned spending on a country's goods and services over a period of time. It has four components: \[ AD = C + I + G + (X - M) \]
| Component | What it is | What changes it |
|---|---|---|
| Consumption (C) | Household spending, the largest component | Real incomes, interest rates, confidence about jobs, house prices and how easy it is to borrow |
| Investment (I) | Firms' spending on capital goods | Expected future sales, interest rates, retained profit, business confidence and new technology |
| Government spending (G) | Spending on public services and infrastructure | Government priorities, the state of its finances and the economic cycle |
| Net exports (X − M) | Exports minus imports | The exchange rate, incomes at home and abroad, trade barriers, and UK prices and quality compared with rivals' |
A rise in any component raises AD, so firms across the economy sell more. A cut in Bank Rate, for example, makes borrowing cheaper → households spend more and firms invest more → C and I rise → AD rises. How AD affects output and prices is covered in unit 4.4.1.
Benefits and pensions are not part of G. G is government spending on goods and services, such as nurses' pay or a new road. Benefits and state pensions are transfers: the government buys nothing in return. They enter AD only when the people who receive them spend the money, as C.
Factors Influencing Aggregate Supply
Aggregate supply (AS): the total output that firms in an economy are willing and able to produce at each price level.
The spec names two factors that change it:
- The cost of inputs and resources: wages, energy or raw material prices rise → it costs more to produce each unit → firms raise prices or supply less → AS falls, so output falls and prices rise. Cheaper inputs run the chain the other way. A weaker pound has the same effect as a price rise for firms that import materials.
- Productivity: better training, equipment or methods → more output from each worker → lower unit costs → firms can supply more at the same prices → AS rises, so output grows without pushing up prices (unit 2.3.1).
The effect depends on:
- How long the change lasts: a short spike in oil prices lifts costs for a while; a lasting gain in productivity raises what the economy can produce for good.
- How much the input matters: a rise in energy prices hits a steelworks far harder than a software firm, so the effect on total supply depends on how widely the input is used.
Stuck on this topic? Work through it with an online A-Level Economics tutor in a free 15-minute intro call, or send an essay on it for A-Level Economics essay marking.