Inflation
Inflation, Deflation and Disinflation
Inflation: a sustained rise in the general level of prices in an economy over time.
The rate of inflation is the percentage rise in the price level over a year. Inflation of 4% means that, on average, what cost £100 a year ago now costs £104.
Deflation: a sustained fall in the general price level, so the rate of inflation is negative.
Disinflation: a fall in the rate of inflation. Prices are still rising, but more slowly.
So if inflation falls from 6% to 3%, that is disinflation. If it falls from 3% to −1%, that is deflation.
Price Indices: CPI and RPI
Price index: a number that shows the price level in one period compared with a base period, which is set at 100.
The Consumer Prices Index (CPI) is the UK's main measure, and the government sets the Bank of England a target of 2% CPI inflation.
Each month the Office for National Statistics (ONS) records the prices of a basket of goods and services that households typically buy. Each item is weighted by its share of household spending, so a rise in energy prices moves the index more than a rise in the price of tea.
The Retail Prices Index (RPI) is an older measure. It includes housing costs that CPI leaves out, such as mortgage interest payments and council tax, and it is usually higher than CPI. The ONS says RPI is not good enough to be an official statistic, but still publishes it because some long-term contracts are linked to it.
An index number is not a rate of inflation. To find the rate of inflation, take the percentage change in the index from one year to the next:
\[ \text{Rate} = \frac{\text{New index} - \text{Old index}}{\text{Old index}} \times 100 \]
Real and Nominal Values
Nominal value: a value measured in the prices of the time, with no adjustment for inflation. Figures at current prices are nominal.
Real value: a value adjusted for inflation, so it shows what has happened to the amount bought or produced. Figures at constant prices are real: they are valued at the prices of one base year.
If a firm's sales rise by 5% while prices rise by 5%, it has sold no more in real terms. To turn a nominal figure into a real one, using a price index with the base year at 100:
\[ \text{Real value} = \frac{\text{Nominal value}}{\text{Price index}} \times 100 \]
Worked Example: A Café's Sales
A café's sales are £200,000 in 2023, £218,400 in 2024 and £224,000 in 2025. The price index (2023 = 100) is 105 in 2024 and 112 in 2025.
| Step | Working | Answer |
|---|---|---|
| Inflation in 2024 | (105 − 100) ÷ 100 × 100 | 5.0% |
| Inflation in 2025 | (112 − 105) ÷ 105 × 100 | 6.7% |
| Real sales in 2024 | £218,400 ÷ 105 × 100 | £208,000 |
| Real sales in 2025 | £224,000 ÷ 112 × 100 | £200,000 |
At current prices, sales rose 2.6% in 2025. At constant 2023 prices they fell 3.8%, back to the 2023 level, because prices rose faster than the café's takings. Its takings look higher, but it is selling less.
Causes of Inflation: Demand-Pull and Cost-Push
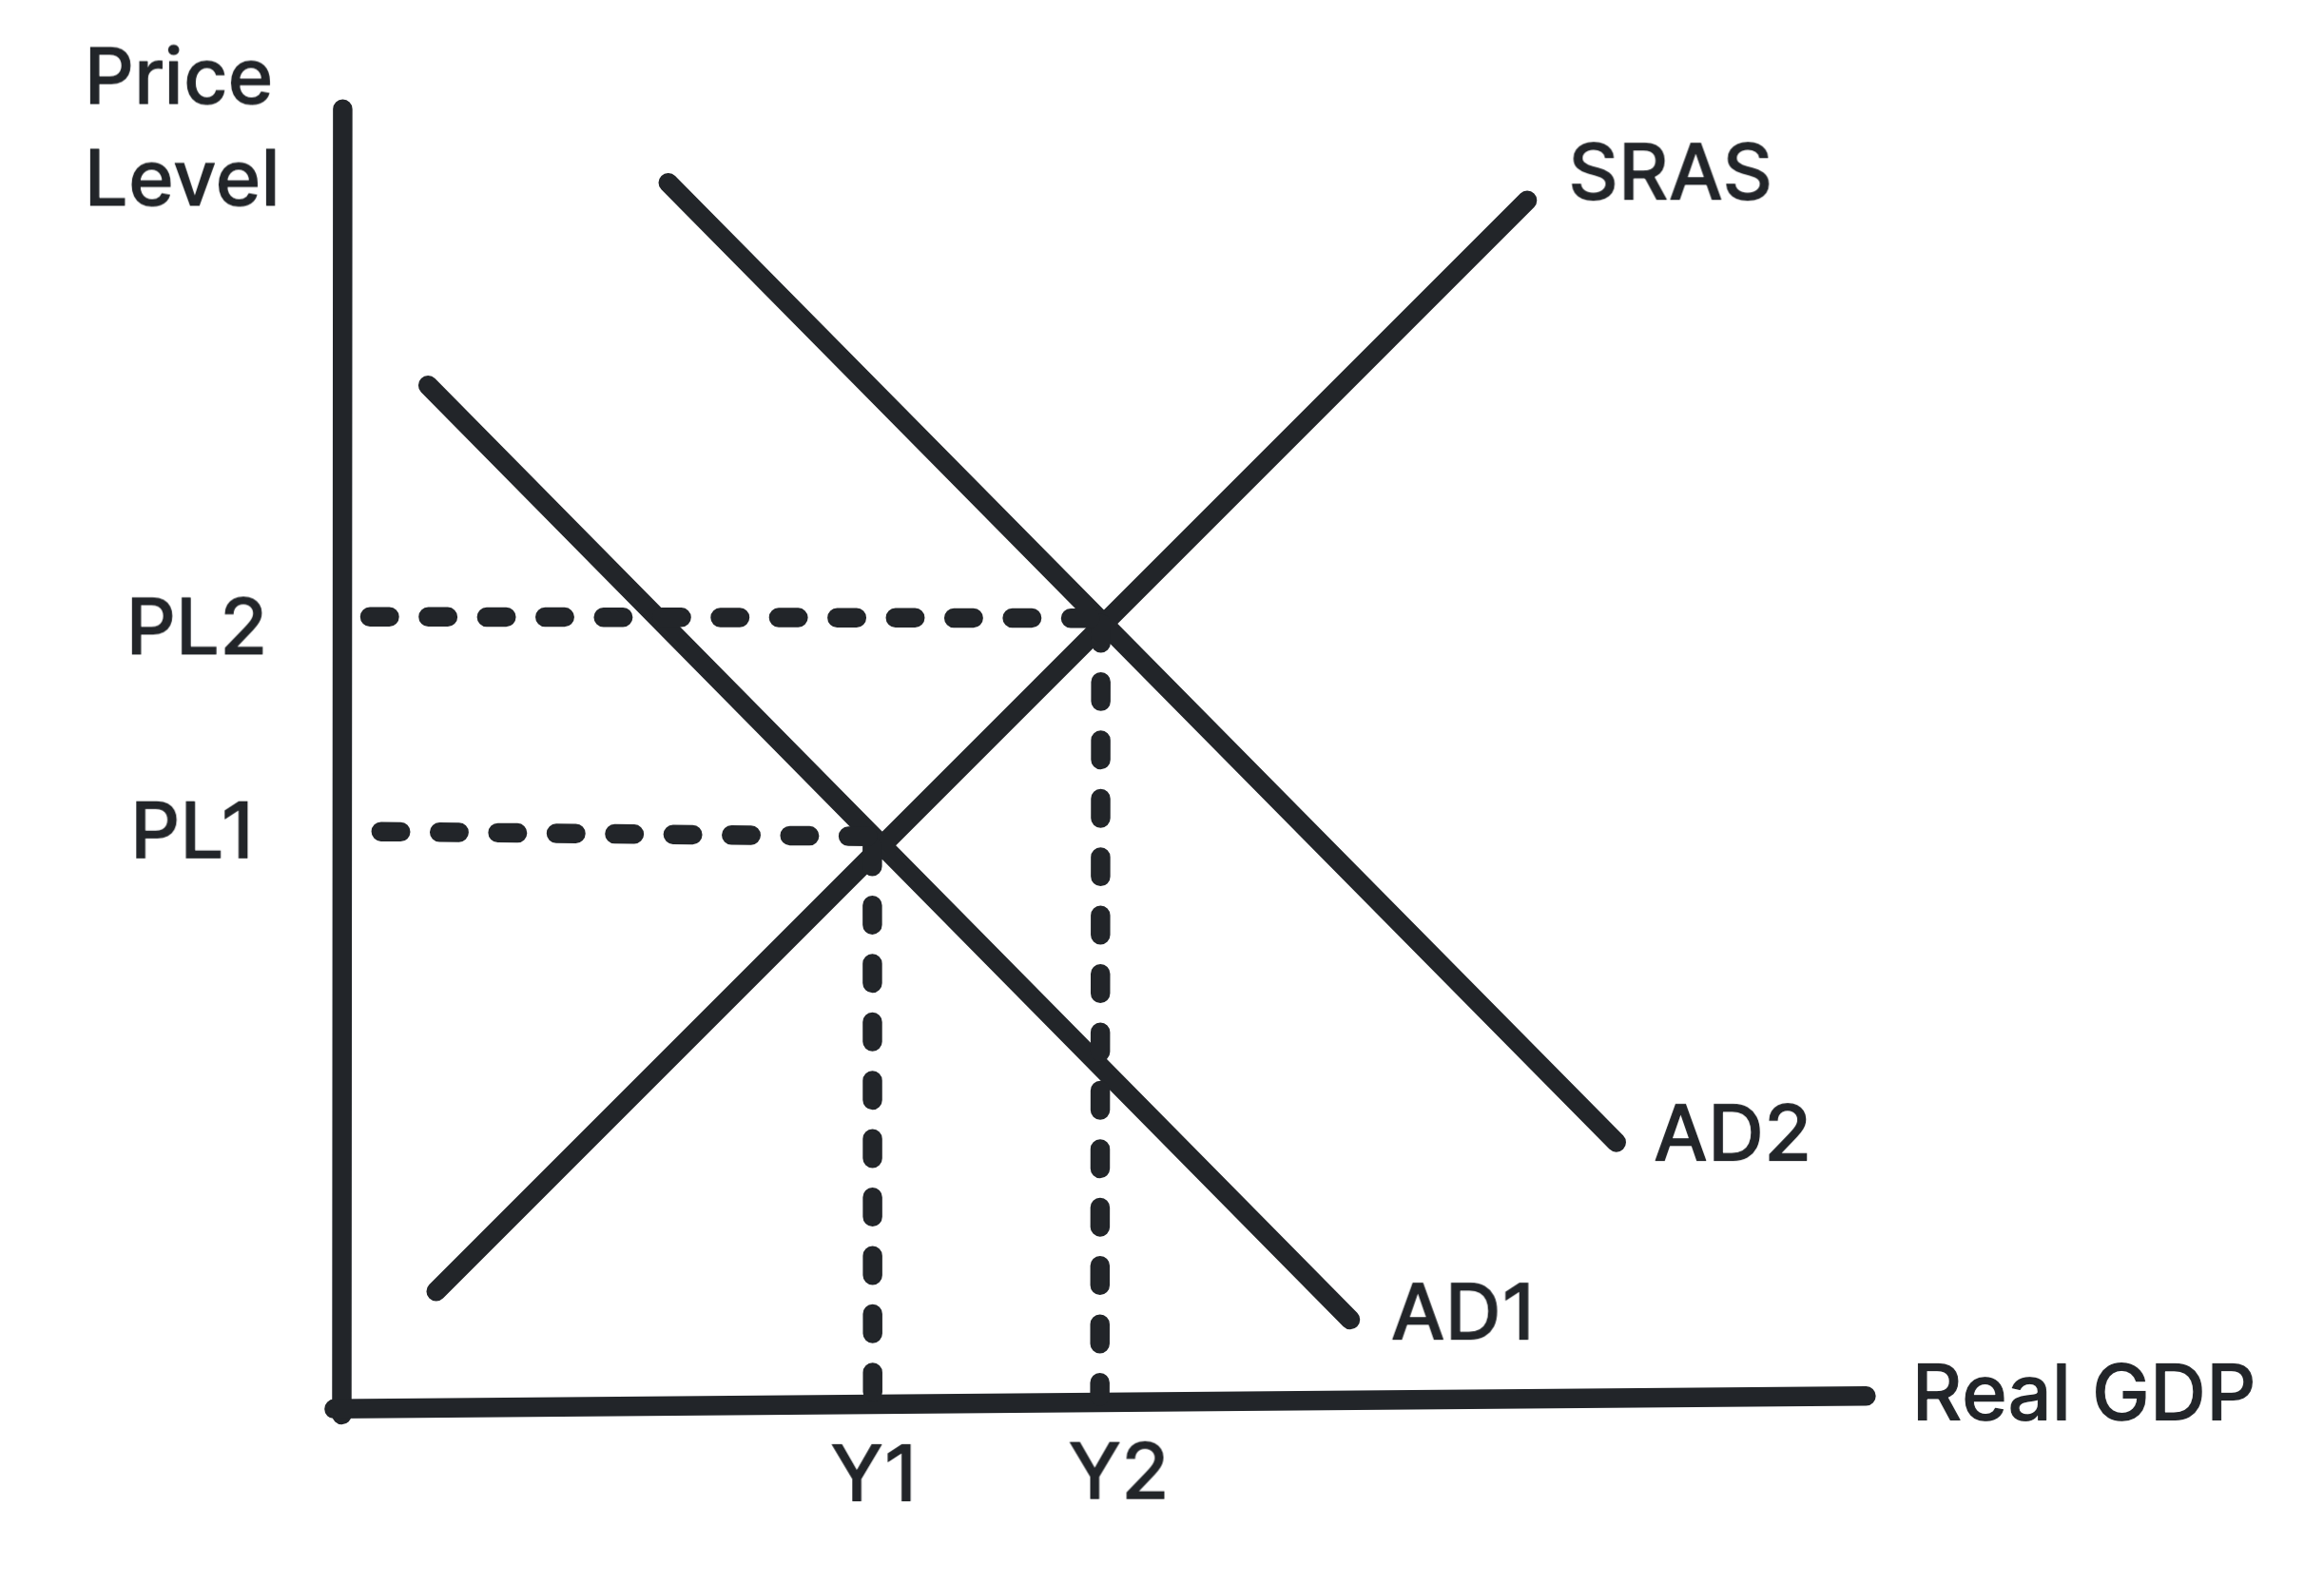
Demand-pull inflation: inflation caused by aggregate demand rising faster than the economy can increase its output.
Interest rates are cut, taxes fall or confidence rises → households and firms spend more → firms near full capacity cannot raise output fast enough → they raise prices, and the price level rises.
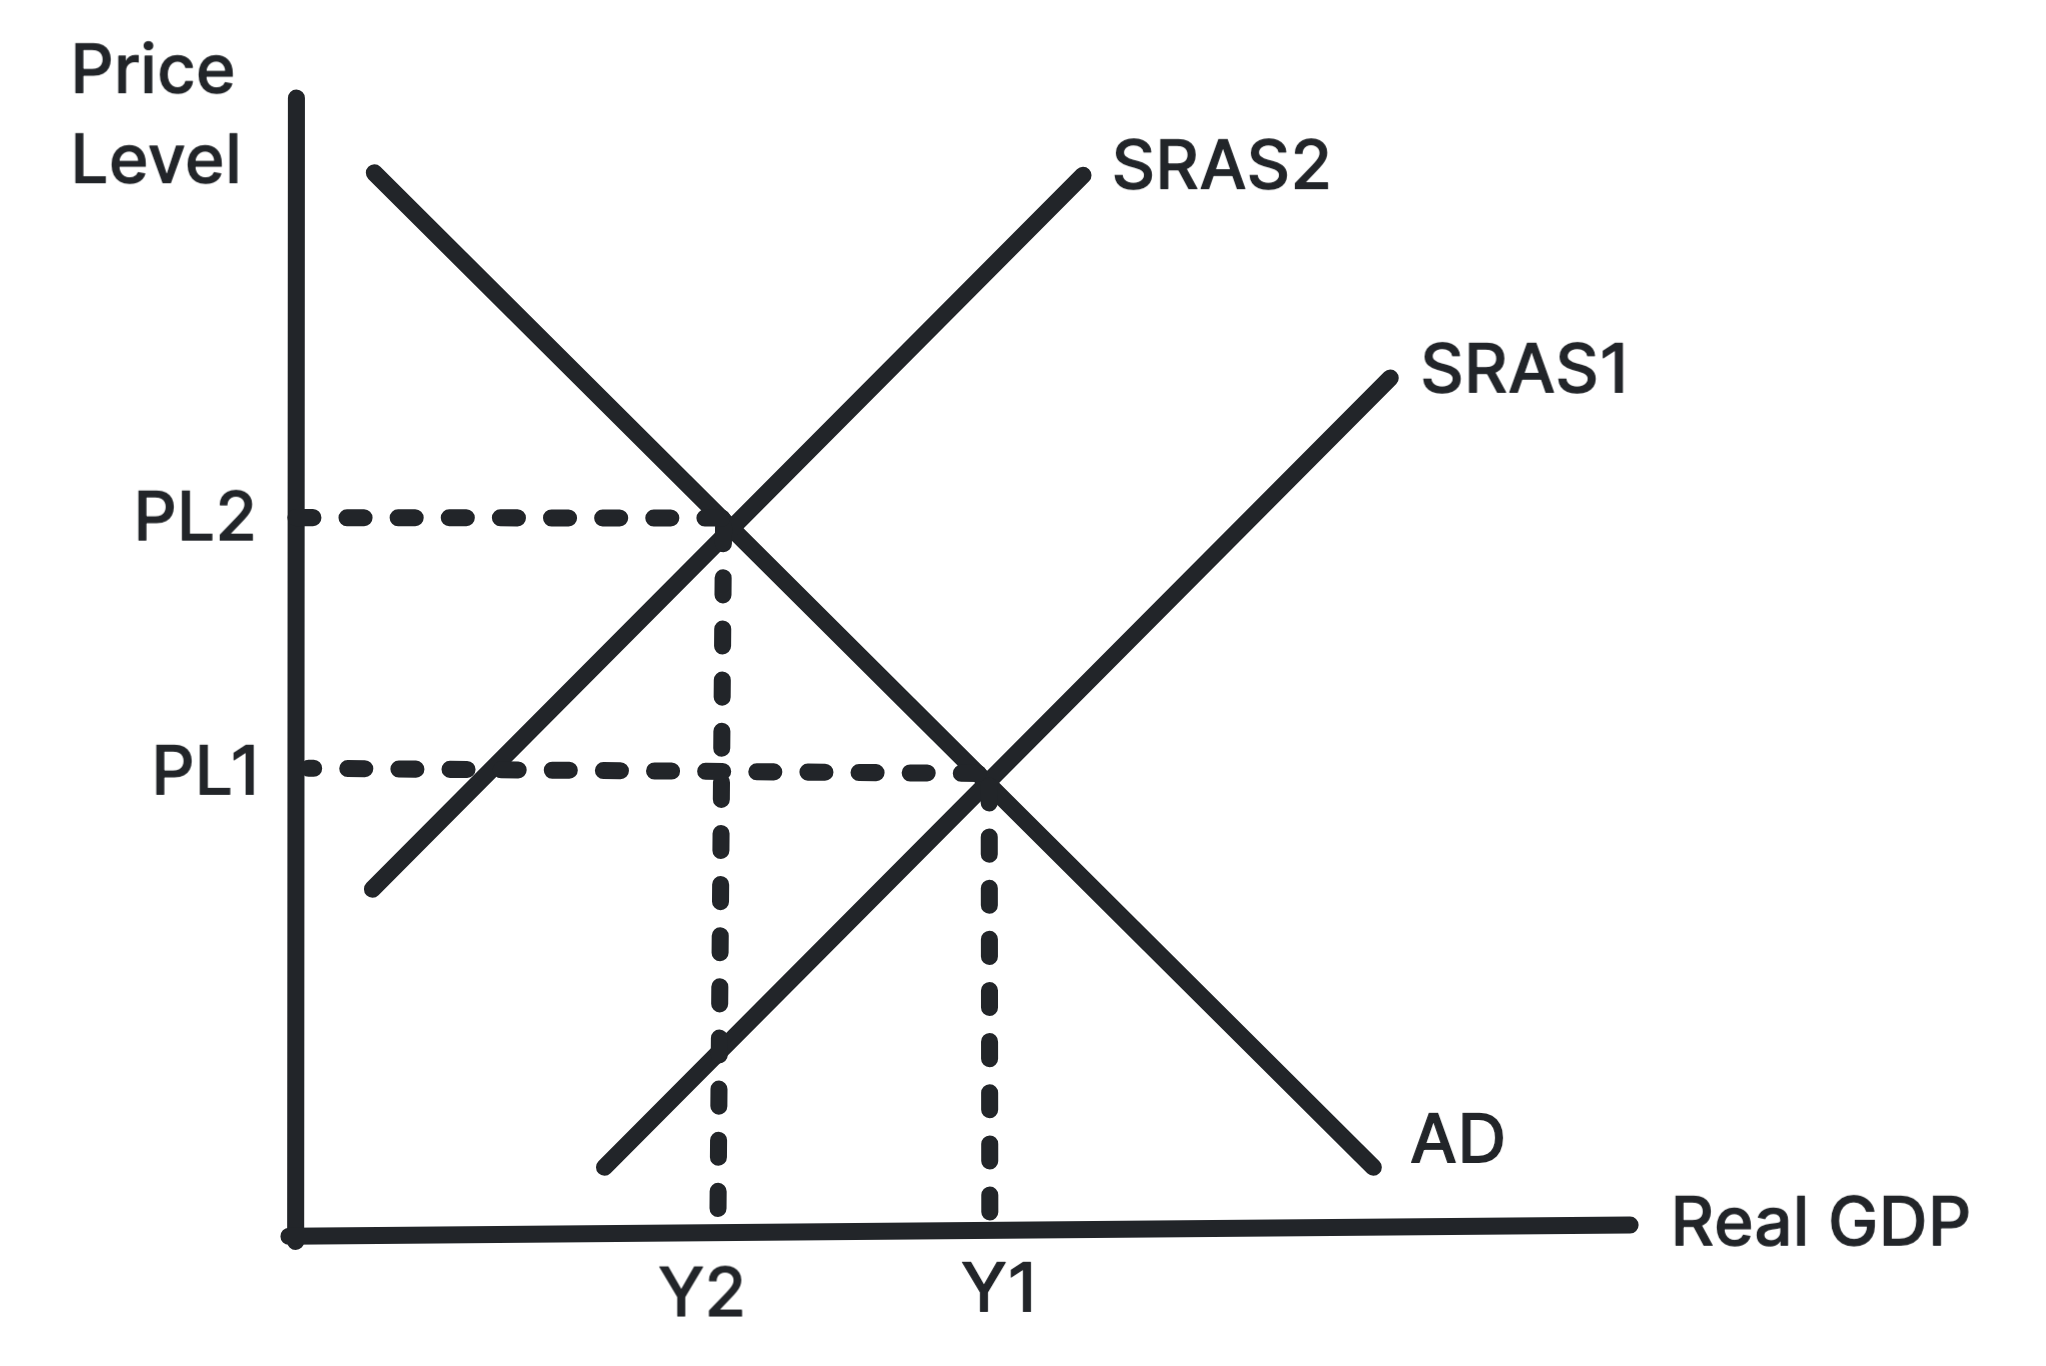
Cost-push inflation: inflation caused by rising costs of production, which firms pass on as higher prices.
Wages, energy, raw materials or indirect taxes rise, or a weaker pound makes imported inputs dearer → unit costs rise → firms raise prices to protect their margins → the price level rises while output falls. When energy prices surged in 2022, UK CPI inflation reached 11.1% in October.
The two can feed each other. Workers ask for higher pay to keep up with prices, which raises firms' costs and pushes prices up again.
The Impact of Inflation on Firms
When inflation is high or rising:
- Uncertainty: costs and prices change quickly and unpredictably → firms cannot forecast costs, revenue or the return on a new project with confidence → they put off investment → slower growth and fewer new jobs.
- Loss of international competitiveness: UK prices rise faster than those of rivals abroad → UK exports look dear to foreign buyers and imports look cheap at home → UK firms lose orders overseas and sales at home → lower revenue and profit.
The effect on a particular firm depends on:
- How high and how predictable inflation is: steady inflation of about 2% is easy to plan around; 10% that keeps changing is not.
- Inflation abroad: competitiveness is lost only if UK inflation is above that in rival countries, and a fall in the pound can offset it.
The Impact of Inflation on Individuals
- Loss of real income: prices rise faster than pay → each pound buys less → real income falls → households cut back and living standards fall. People on fixed incomes, and those whose pay rises late, are hit hardest.
- Savers lose: inflation is higher than the interest rate on savings → the money saved buys less each year → the real value of savings falls. Savings earning 4% while inflation is 6% lose about 2% a year in real terms.
- Borrowers gain: debts are fixed in pounds → inflation raises prices and, in time, wages → the debt becomes smaller in real terms and easier to repay.
The effect depends on:
- Whether incomes keep up: if pay, pensions and benefits rise in line with prices, real incomes hold steady.
- What happens to interest rates: the Bank of England usually raises them to bring inflation down. That helps savers, but borrowers on variable rates then pay more, which can outweigh the gain from inflation.
A pay rise is not always a gain. Compare it with inflation first. A 3% pay rise with 5% inflation is a real pay cut of about 2%. When an extract gives you both figures, the real change is the one to analyse.
Stuck on this topic? Work through it with an online A-Level Economics tutor in a free 15-minute intro call, or send an essay on it for A-Level Economics essay marking.