Economic Growth and the Economic Cycle
Short-Run vs. Long-Run Growth
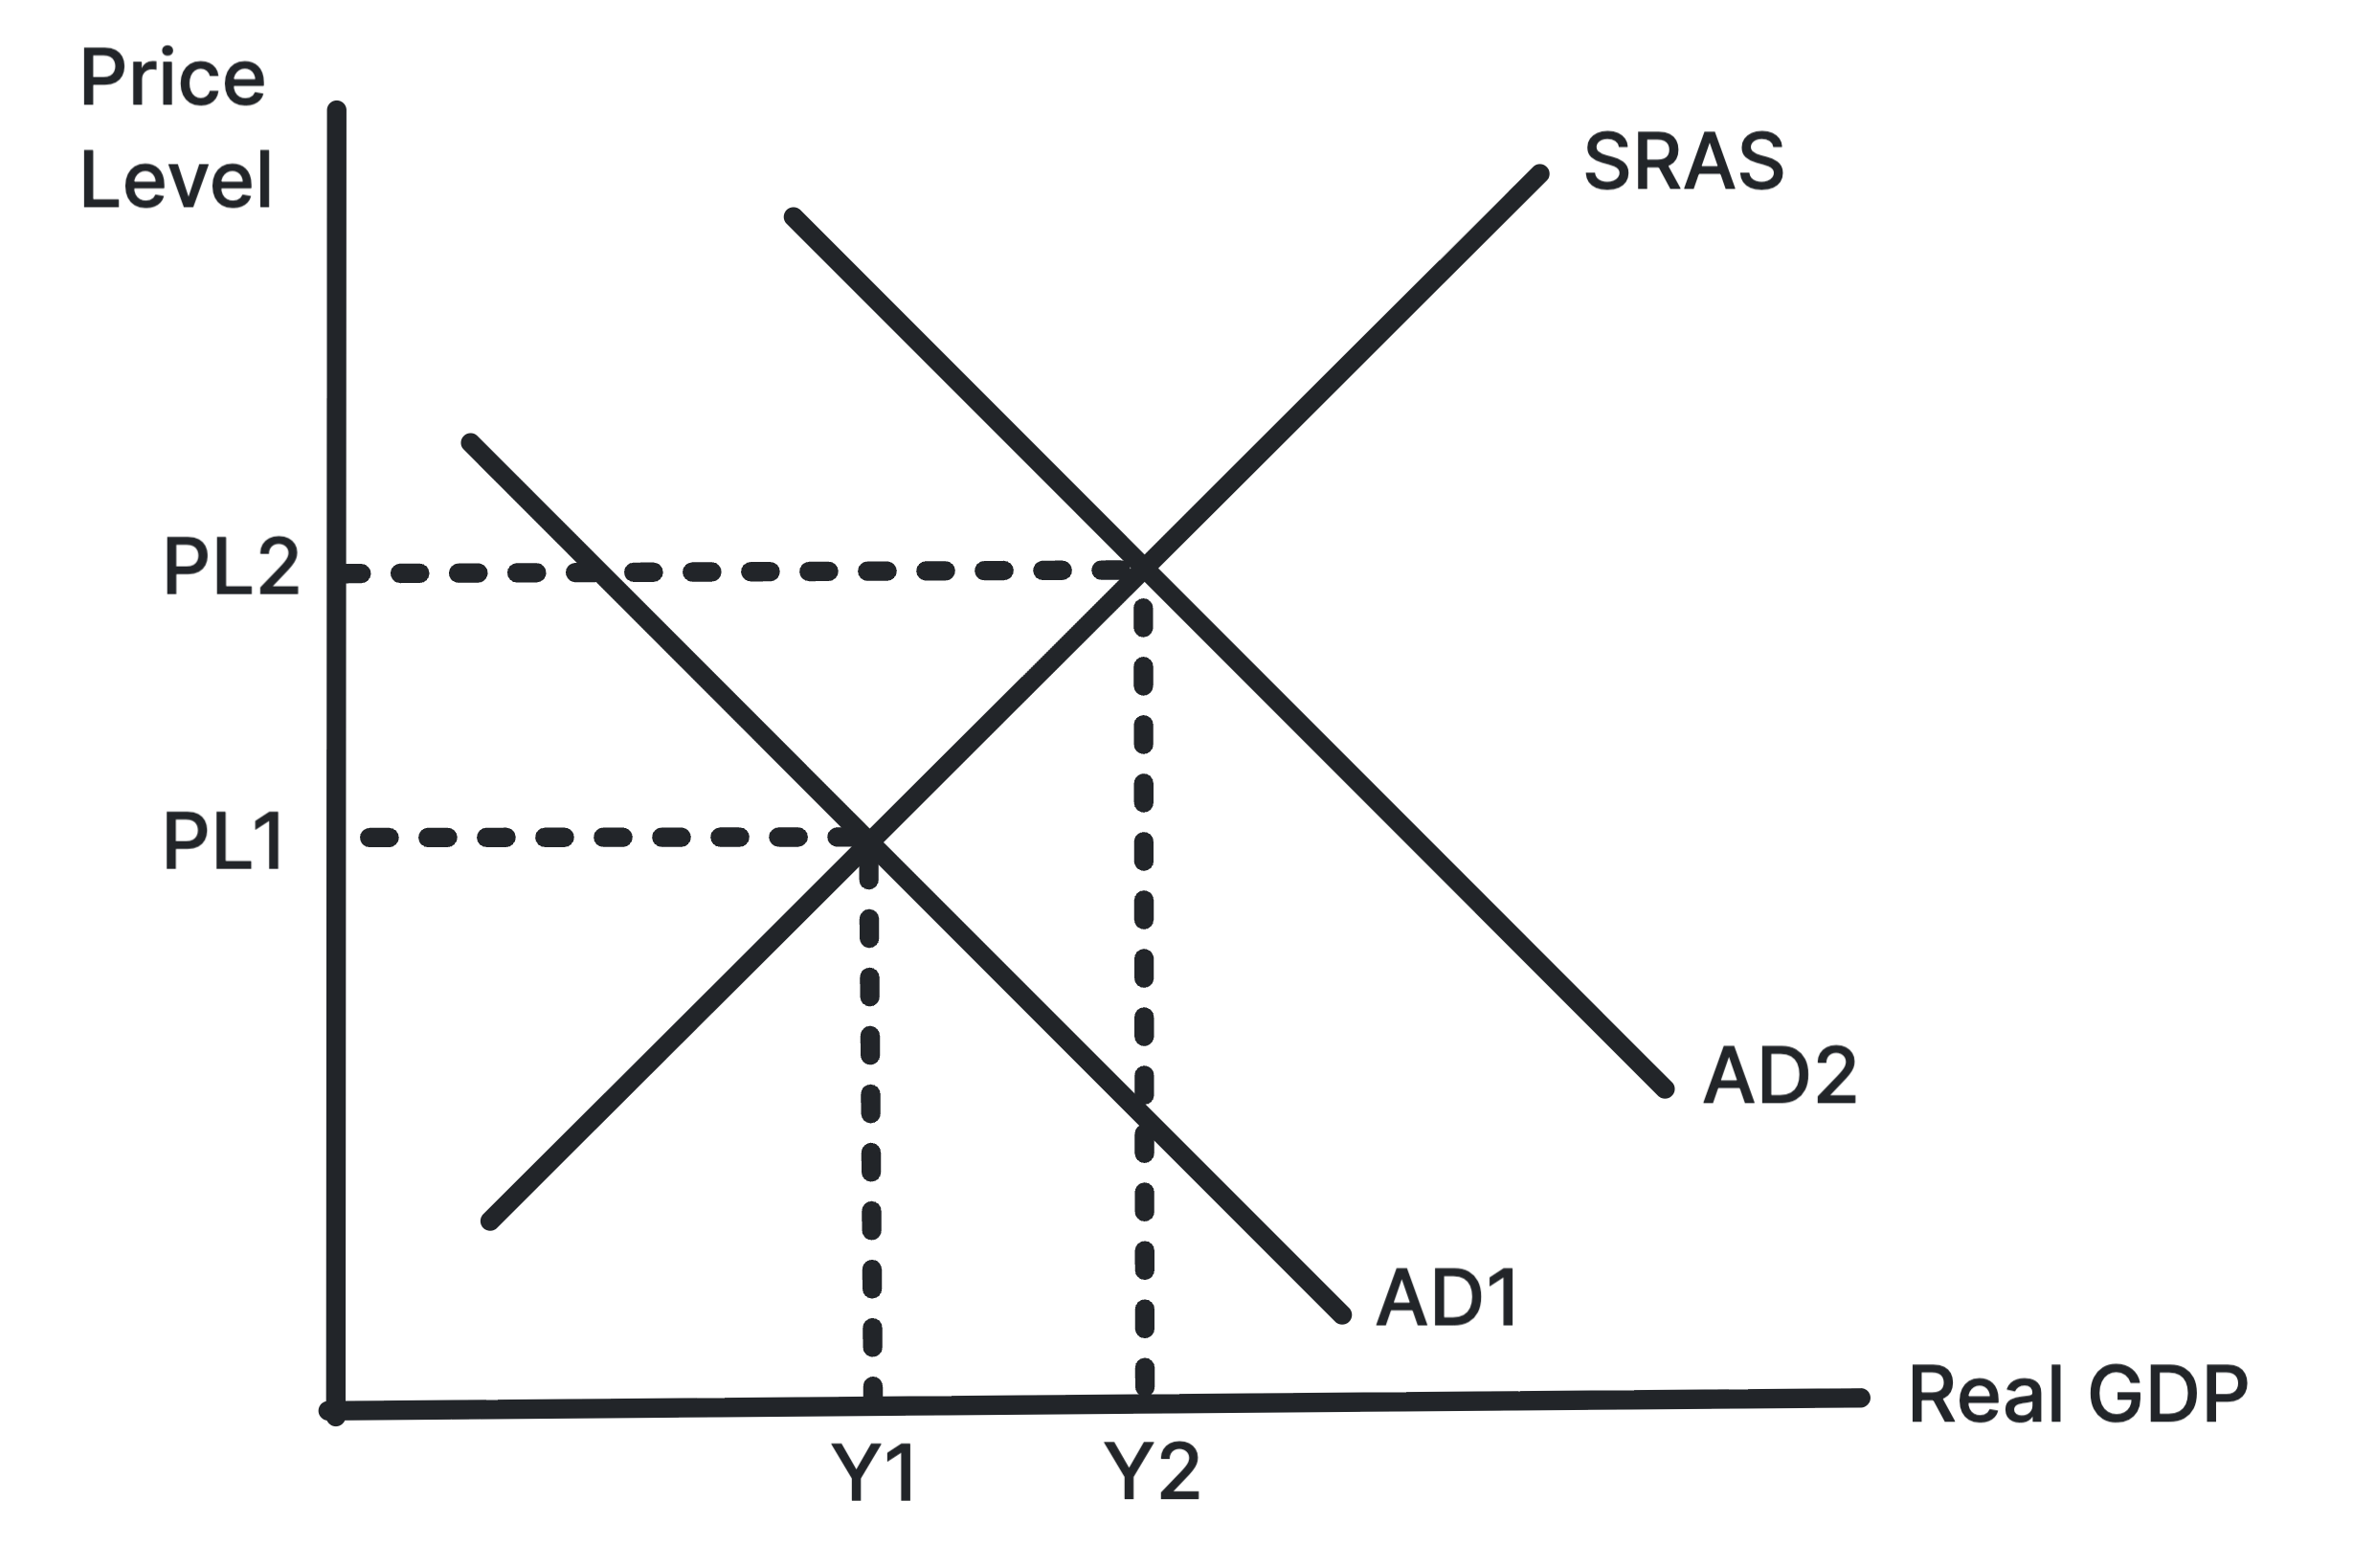
Short-Run Growth: An increase in real GDP over time. It is measured by the percentage change in the actual output of goods and services. Also known as actual growth.
Long-Run Growth: An increase in the economy's productive capacity. This is the maximum possible output the economy could produce if all resources were fully employed. Also known as potential growth.
Short-Run Economic Growth
Cause: An increase in aggregate demand or SRAS.
This may be triggered by a rise in any component of AD: consumption, investment, government spending, or net exports, or an increase in SRAS due to lower costs of production, such as lower wages or lower raw material prices.
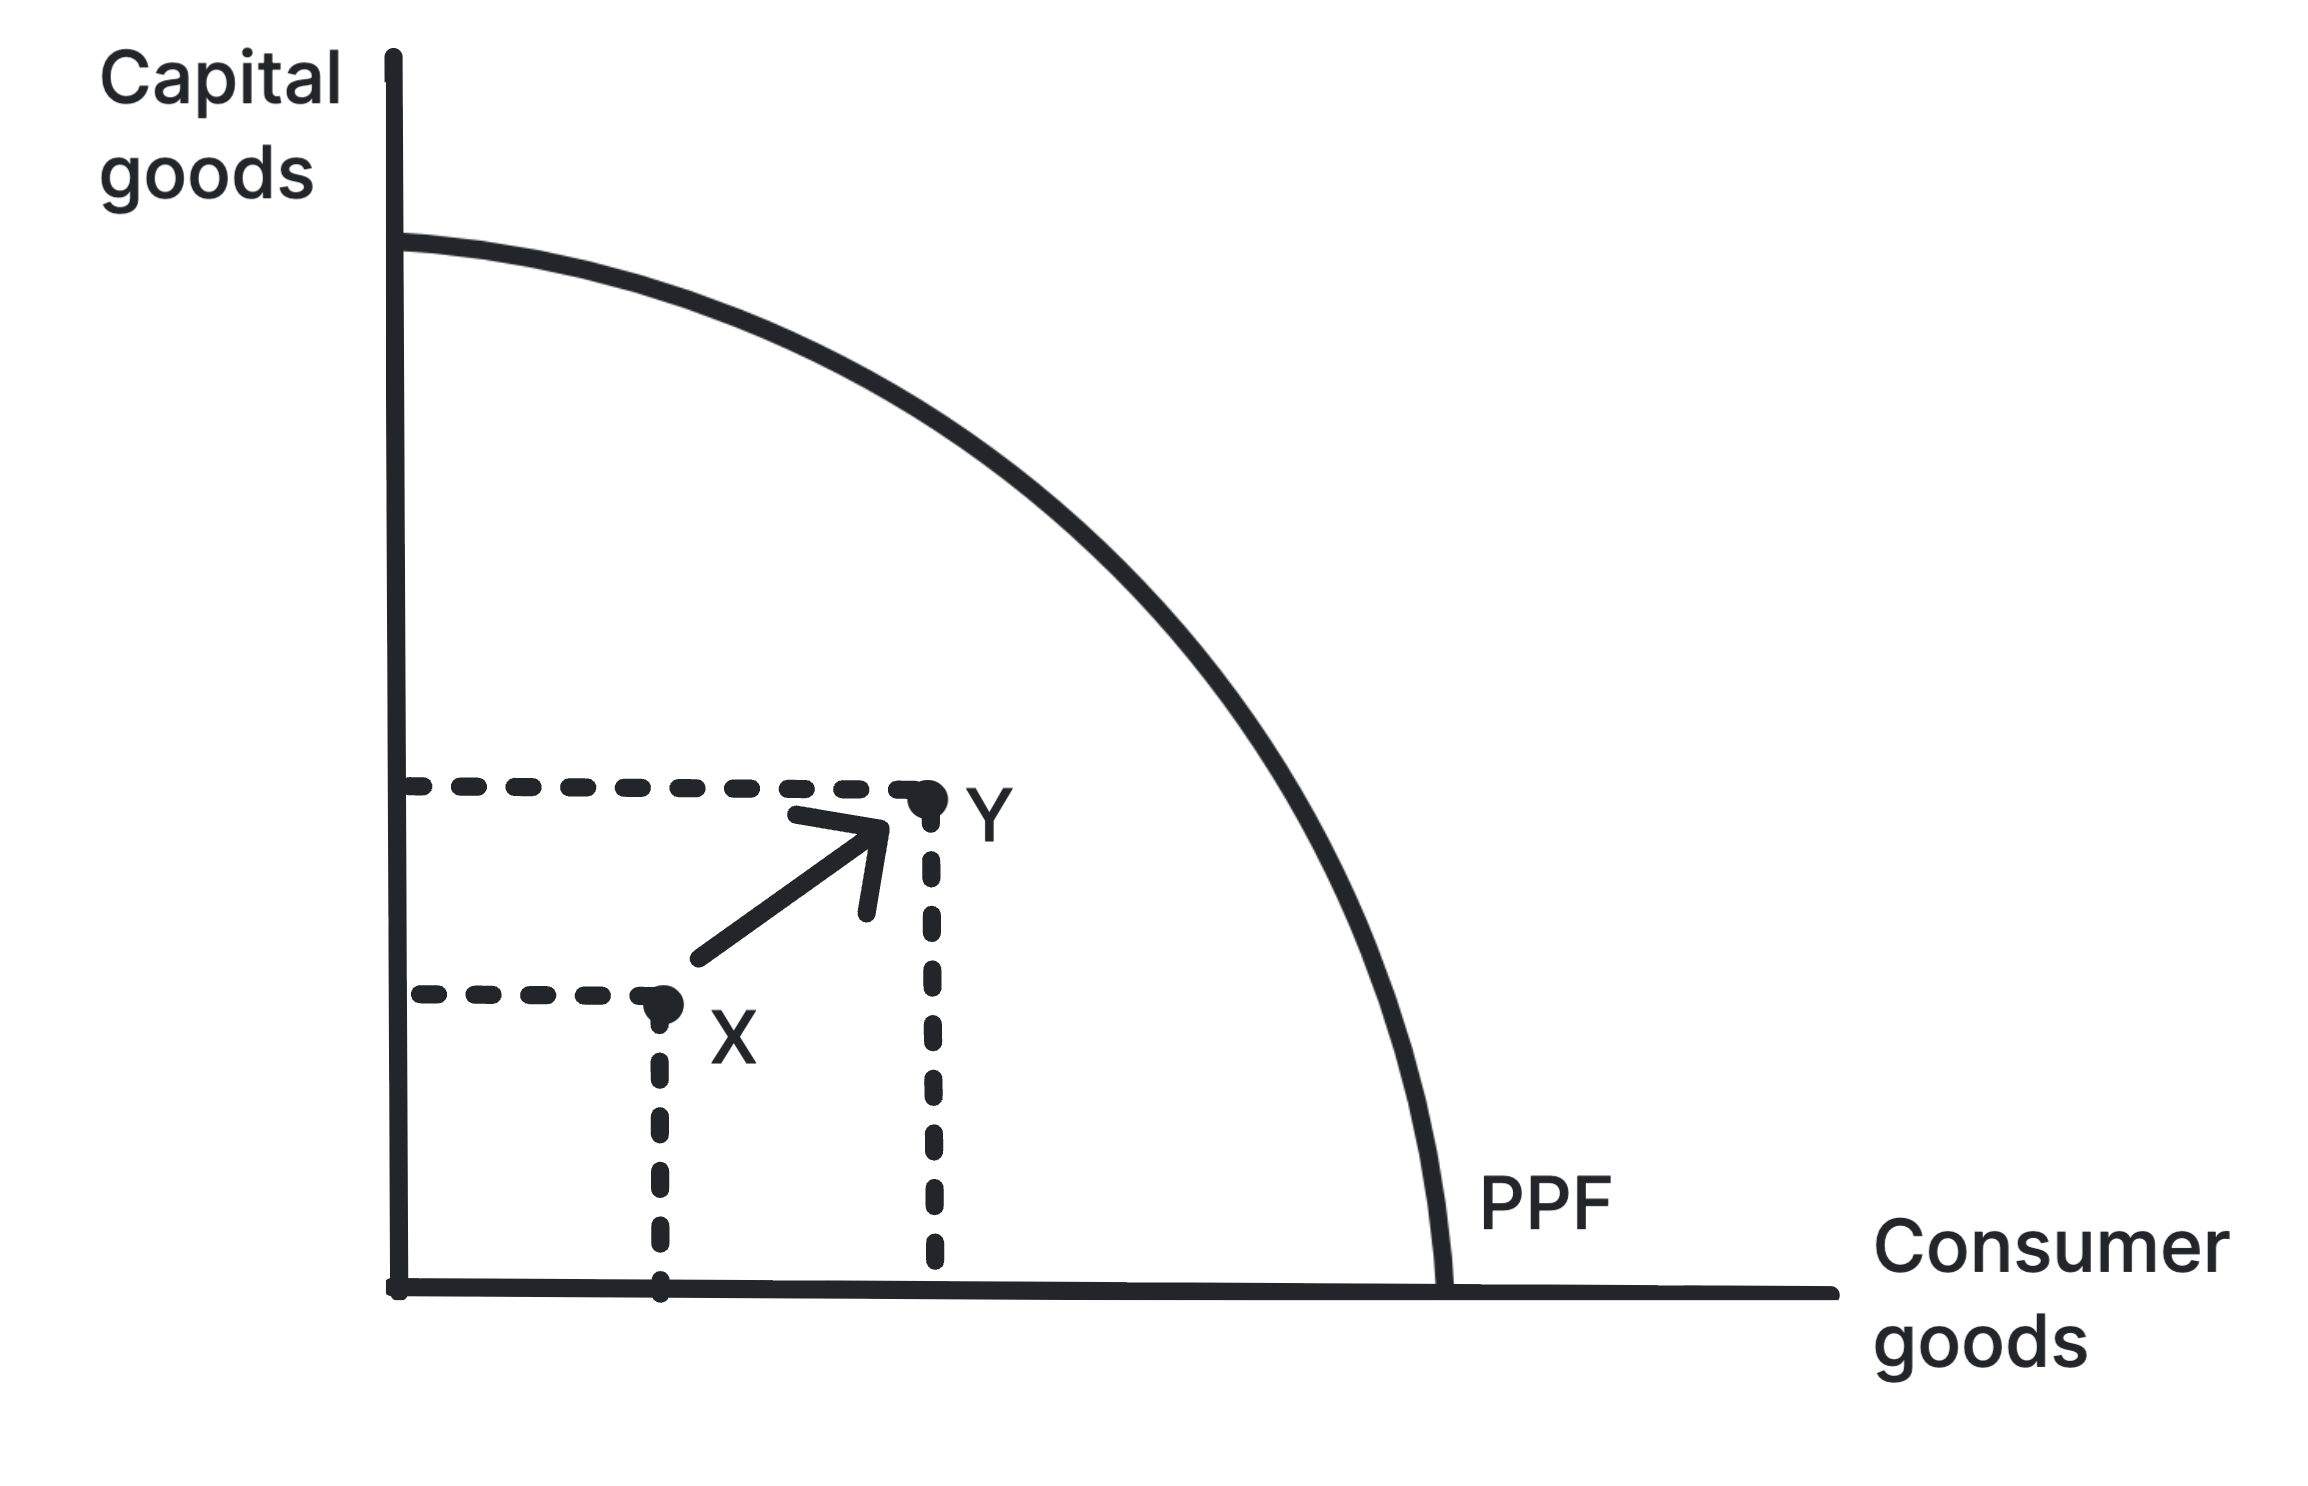
Result: The economy moves closer to its existing productive potential, which can be shown as moving from inside the PPF towards the frontier.
Long-Run Economic Growth
Cause: An increase in the quality or quantity of the factors of production, including land, labour, capital, and enterprise.
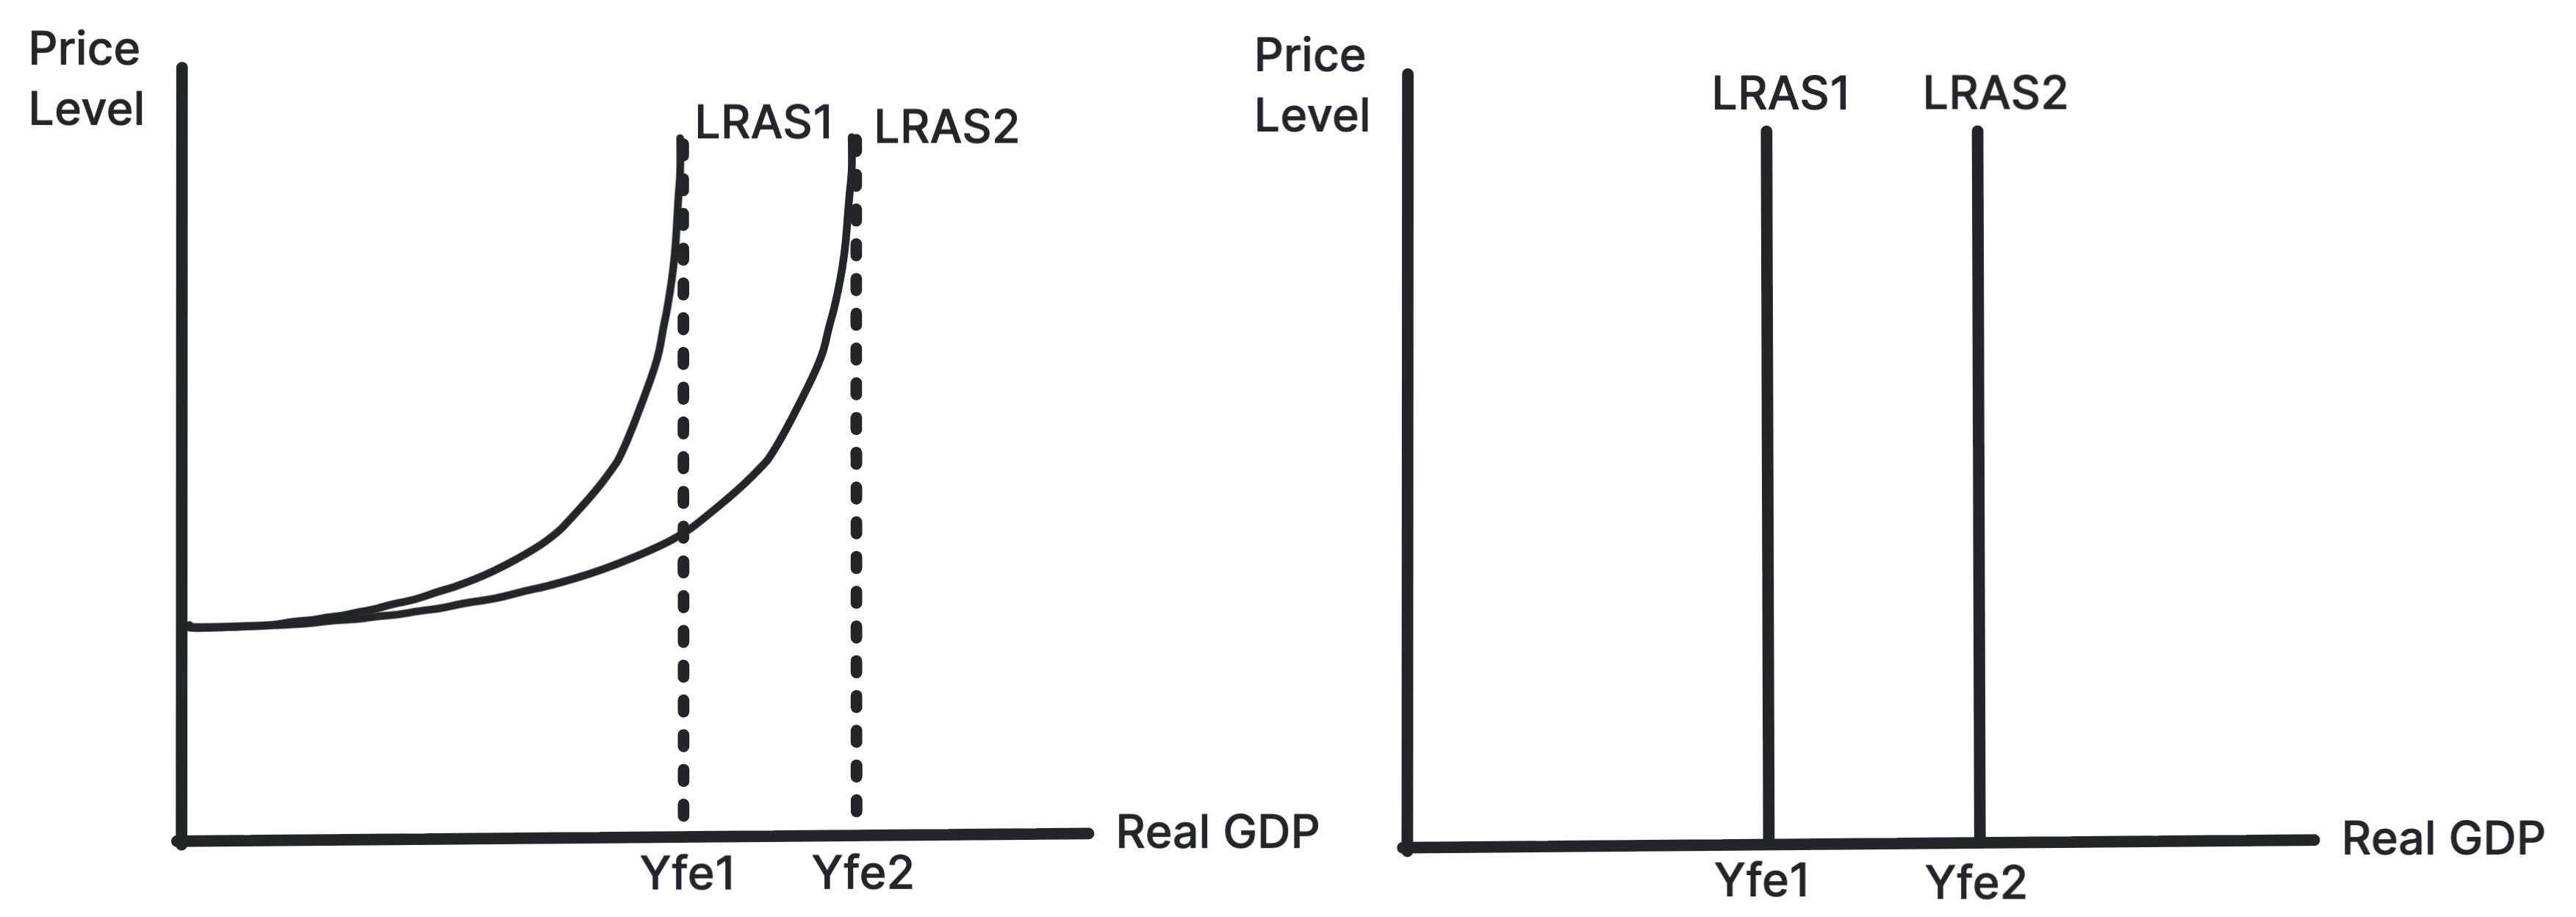
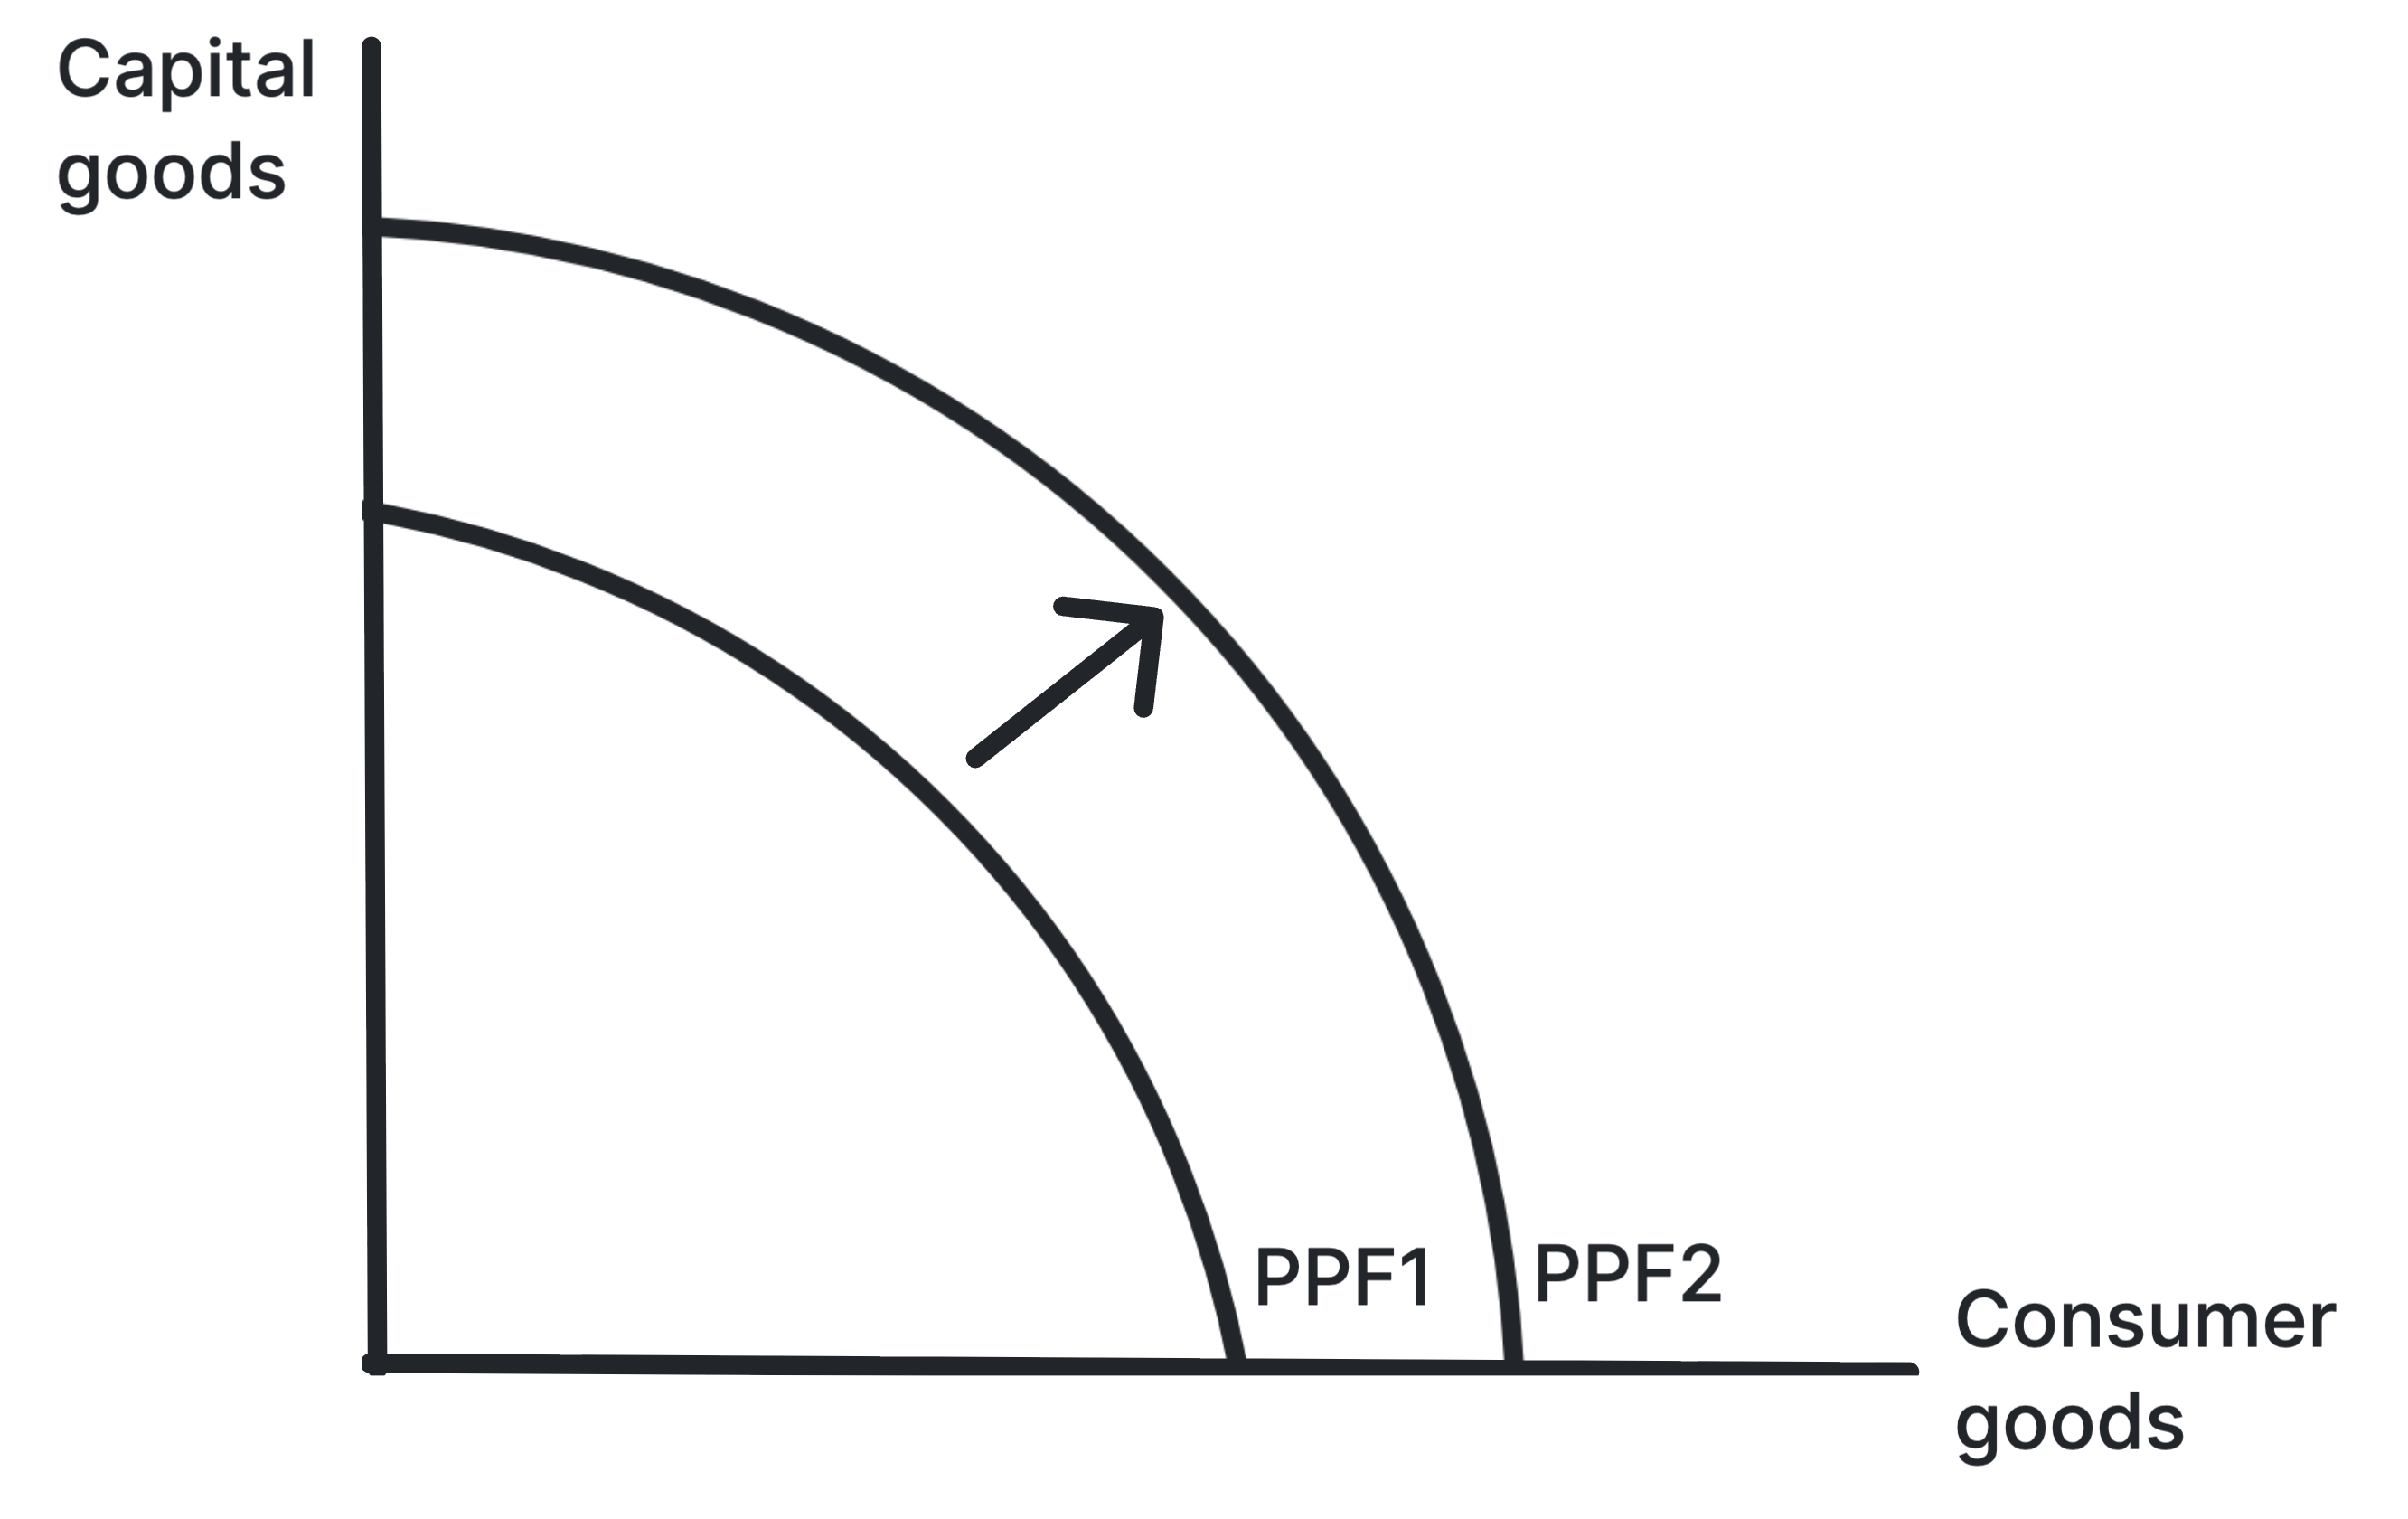
Result: A shift outward of the LRAS curve and the production possibility frontier. This is an increase in potential output.
Factors Causing Long-Run Growth
These factors shift the LRAS curve outwards.
| Factor | How It Increases Potential Output |
|---|---|
| Technological Advances | Improve the quality of capital and make production more efficient. |
| Investment in Capital | Increase the quantity and quality of physical capital, such as machinery and infrastructure. |
| Improvements in Human Capital | Improve the quality of labour through better education, training, and healthcare. |
| Demographic Changes | Increase the quantity of labour through population growth or positive net migration. |
| Increased Competition and Enterprise | Create more efficient markets and encourage innovation. |
| Institutional Improvements | Better legal systems, property rights, and political stability encourage investment and growth. |
The Benefits and Costs of Economic Growth
Economic growth is a key macroeconomic objective, but it involves trade-offs. The benefits and costs are not shared equally, so it is important to consider the impact on individuals, the economy, and the environment separately.
| Impact On | Benefits | Costs |
|---|---|---|
| Individuals |
|
|
| The Economy |
|
|
| The Environment |
|
|
The Trade Cycle
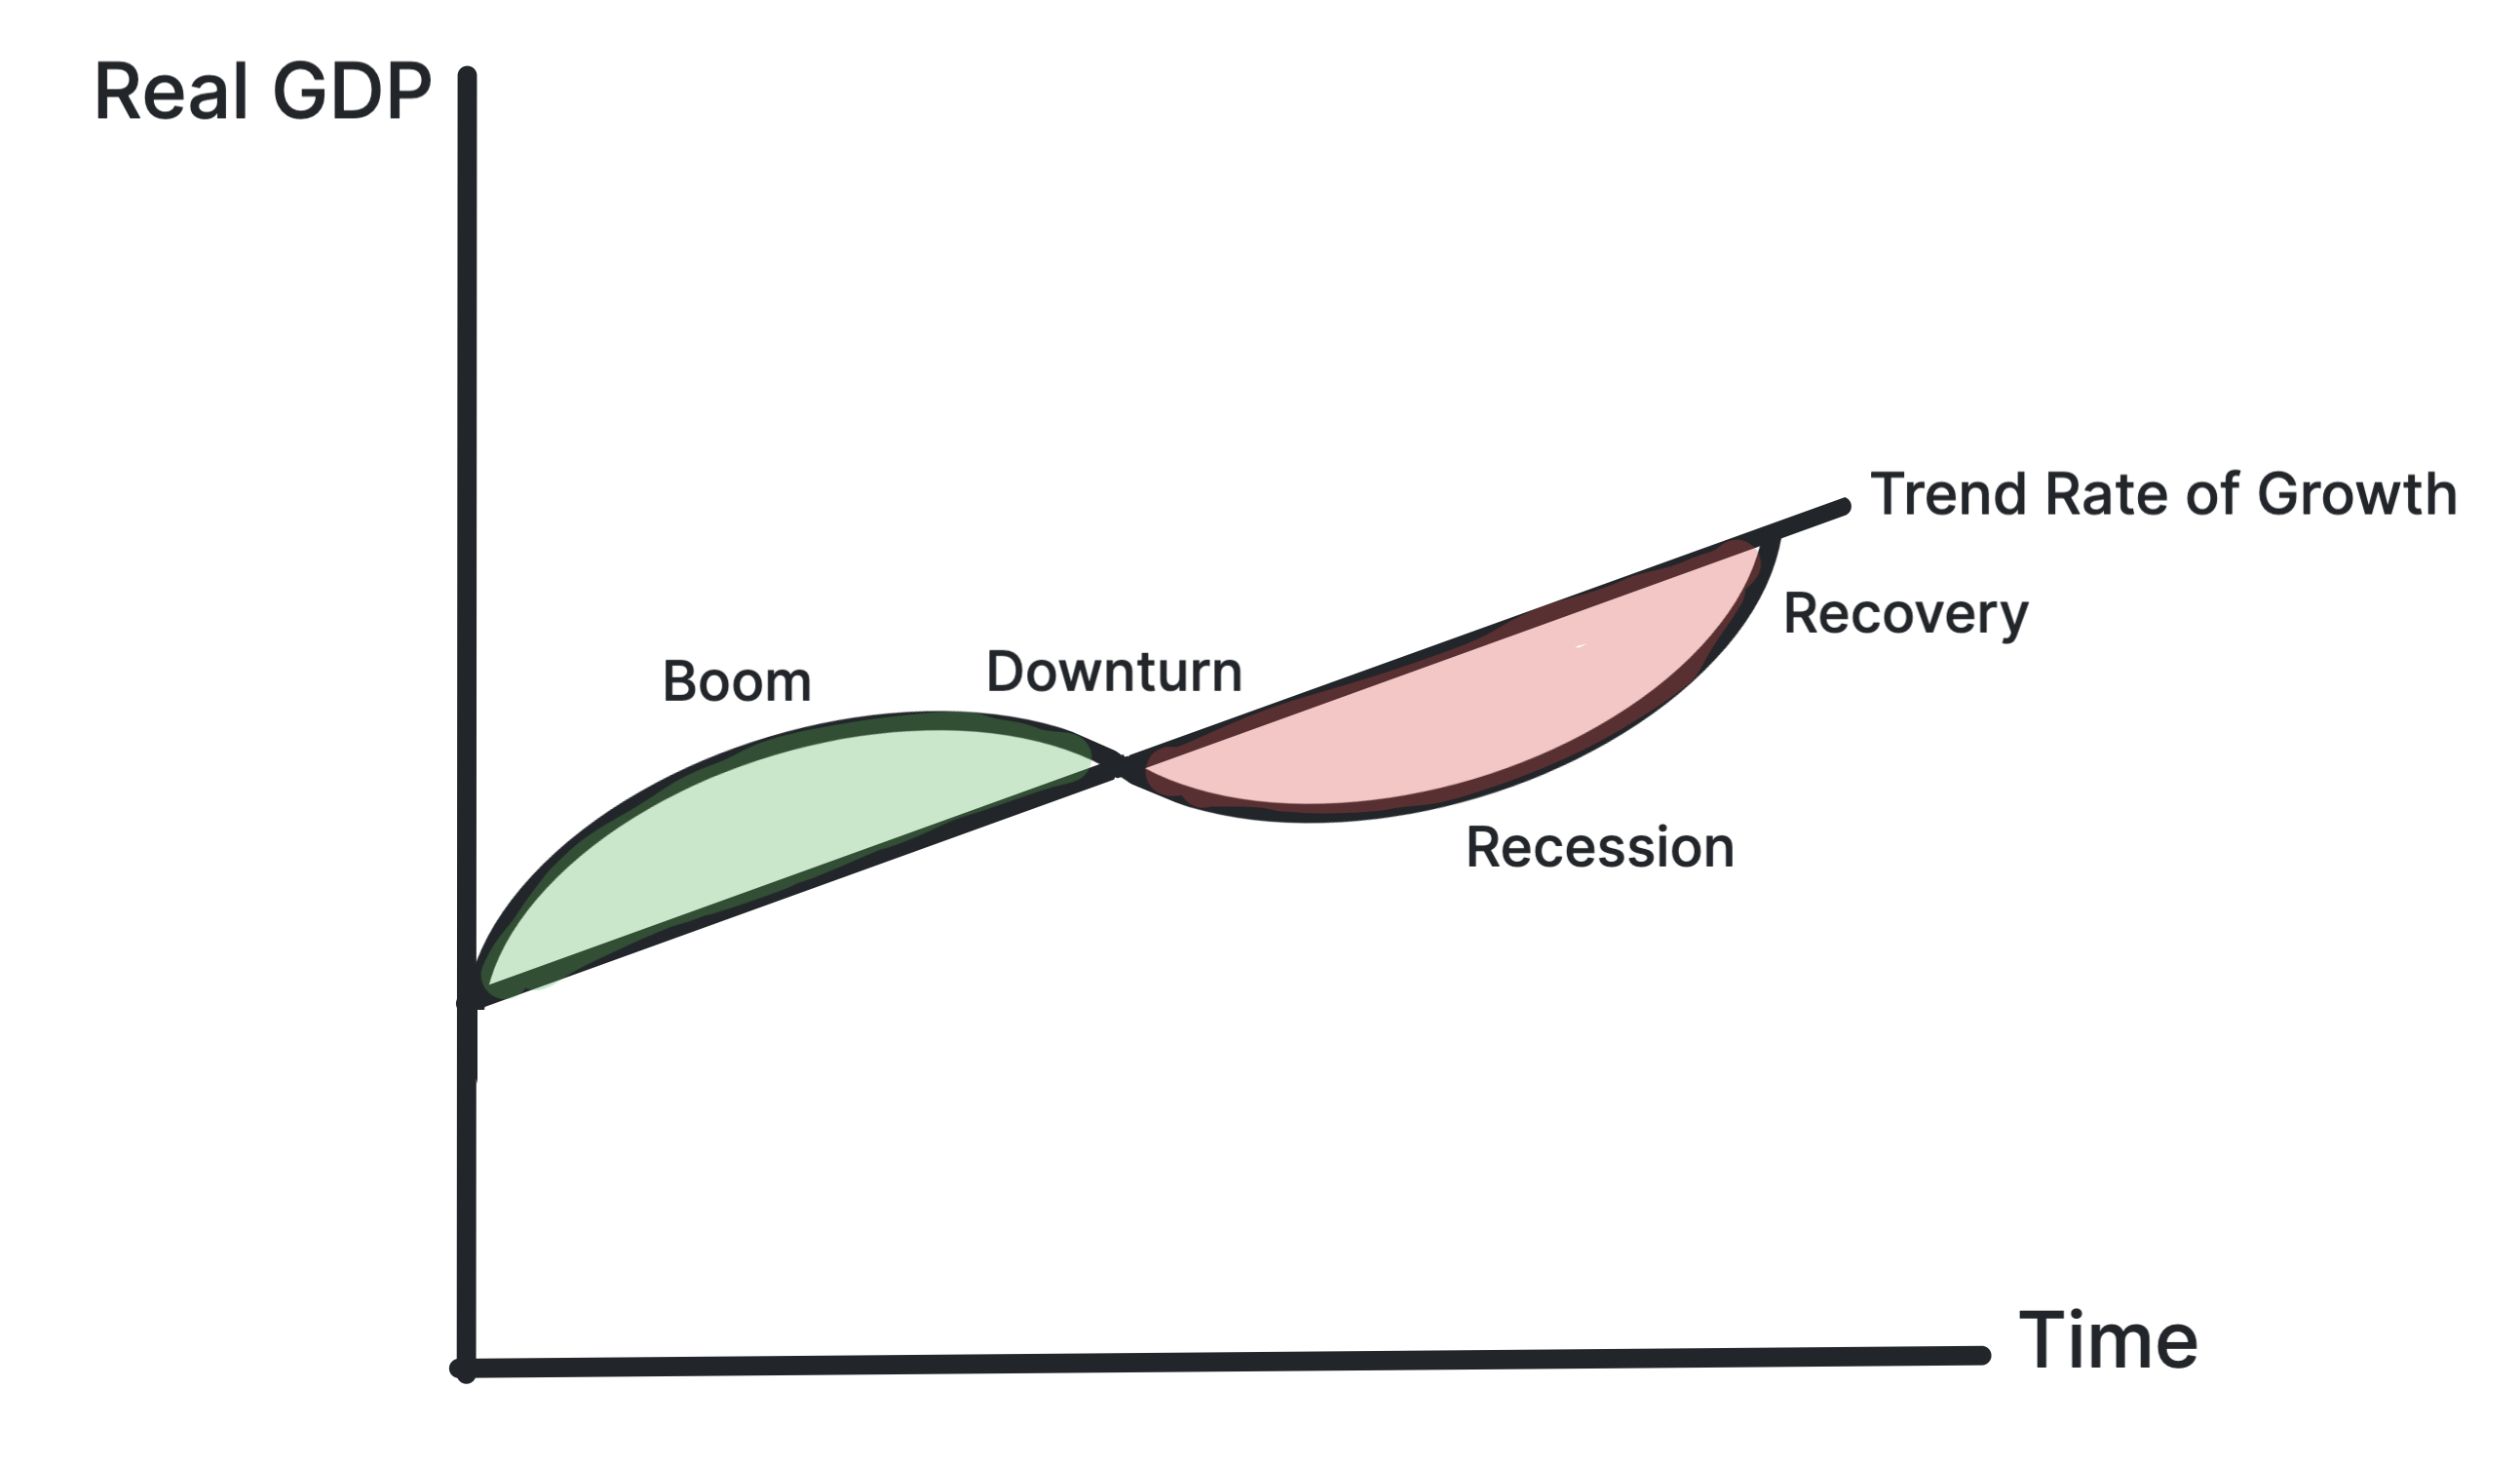
Definition: The trade cycle is the fluctuation in real GDP over time, with periods of boom and recession.
Key Idea: Actual GDP rises and falls around the underlying long-term trend rate of growth, which represents the path of potential GDP or LRAS.
The Stages of the Trade Cycle
Characteristics of Booms and Recessions
| Boom | Recession |
|---|---|
| High and rising real GDP | Falling real GDP |
| Low unemployment | Rising unemployment |
| High inflation (demand-pull) | Low or falling inflation |
| Positive output gap | Negative output gap |
| High consumer and business confidence | Low consumer and business confidence |
| High levels of investment | Low levels of investment |
| Rising government tax revenue | Falling government tax revenue |
Output Gaps and the Trade Cycle
- During a boom, the economy operates with a positive output gap, where actual output is above potential output. This is represented by the green area on the diagram.
- During a recession, the economy operates with a negative output gap, where actual output is below potential output. This is represented by the red area on the diagram.
- The trend line represents the path of potential output, while fluctuations around it reflect changes in aggregate demand.
Causes of the Trade Cycle
The trade cycle is caused by fluctuations in aggregate demand, which can be influenced by changes in:
- Consumer confidence and spending, which can be affected by factors such as interest rates, inflation, and employment prospects. When consumers are confident, they are more likely to spend, boosting aggregate demand and contributing to a boom. Conversely, when confidence is low, consumers may cut back on spending, leading to a recession.
- Business investment, which can be influenced by factors such as interest rates, expected returns, and economic outlook. High levels of investment can drive economic growth and contribute to a boom, while low levels of investment can lead to a slowdown and recession.
The Role of Government
Governments and central banks try to smooth the cycle and reduce the severity of booms and recessions through demand-side stabilisation policy.
During a boom: They may use contractionary policies such as higher interest rates, higher taxes, or lower government spending to cool aggregate demand and control inflation.
During a recession: They may use expansionary policies such as lower interest rates, lower taxes, or higher government spending to boost aggregate demand, close the negative output gap, and reduce unemployment.
Output Gaps
Definition: An output gap is the difference between the actual level of real GDP and the potential level of real GDP, which is the level of output produced when the economy is at full capacity.
\[ \text{Output Gap} = \text{Y} - \text{Yfe} \]
Negative Output Gap
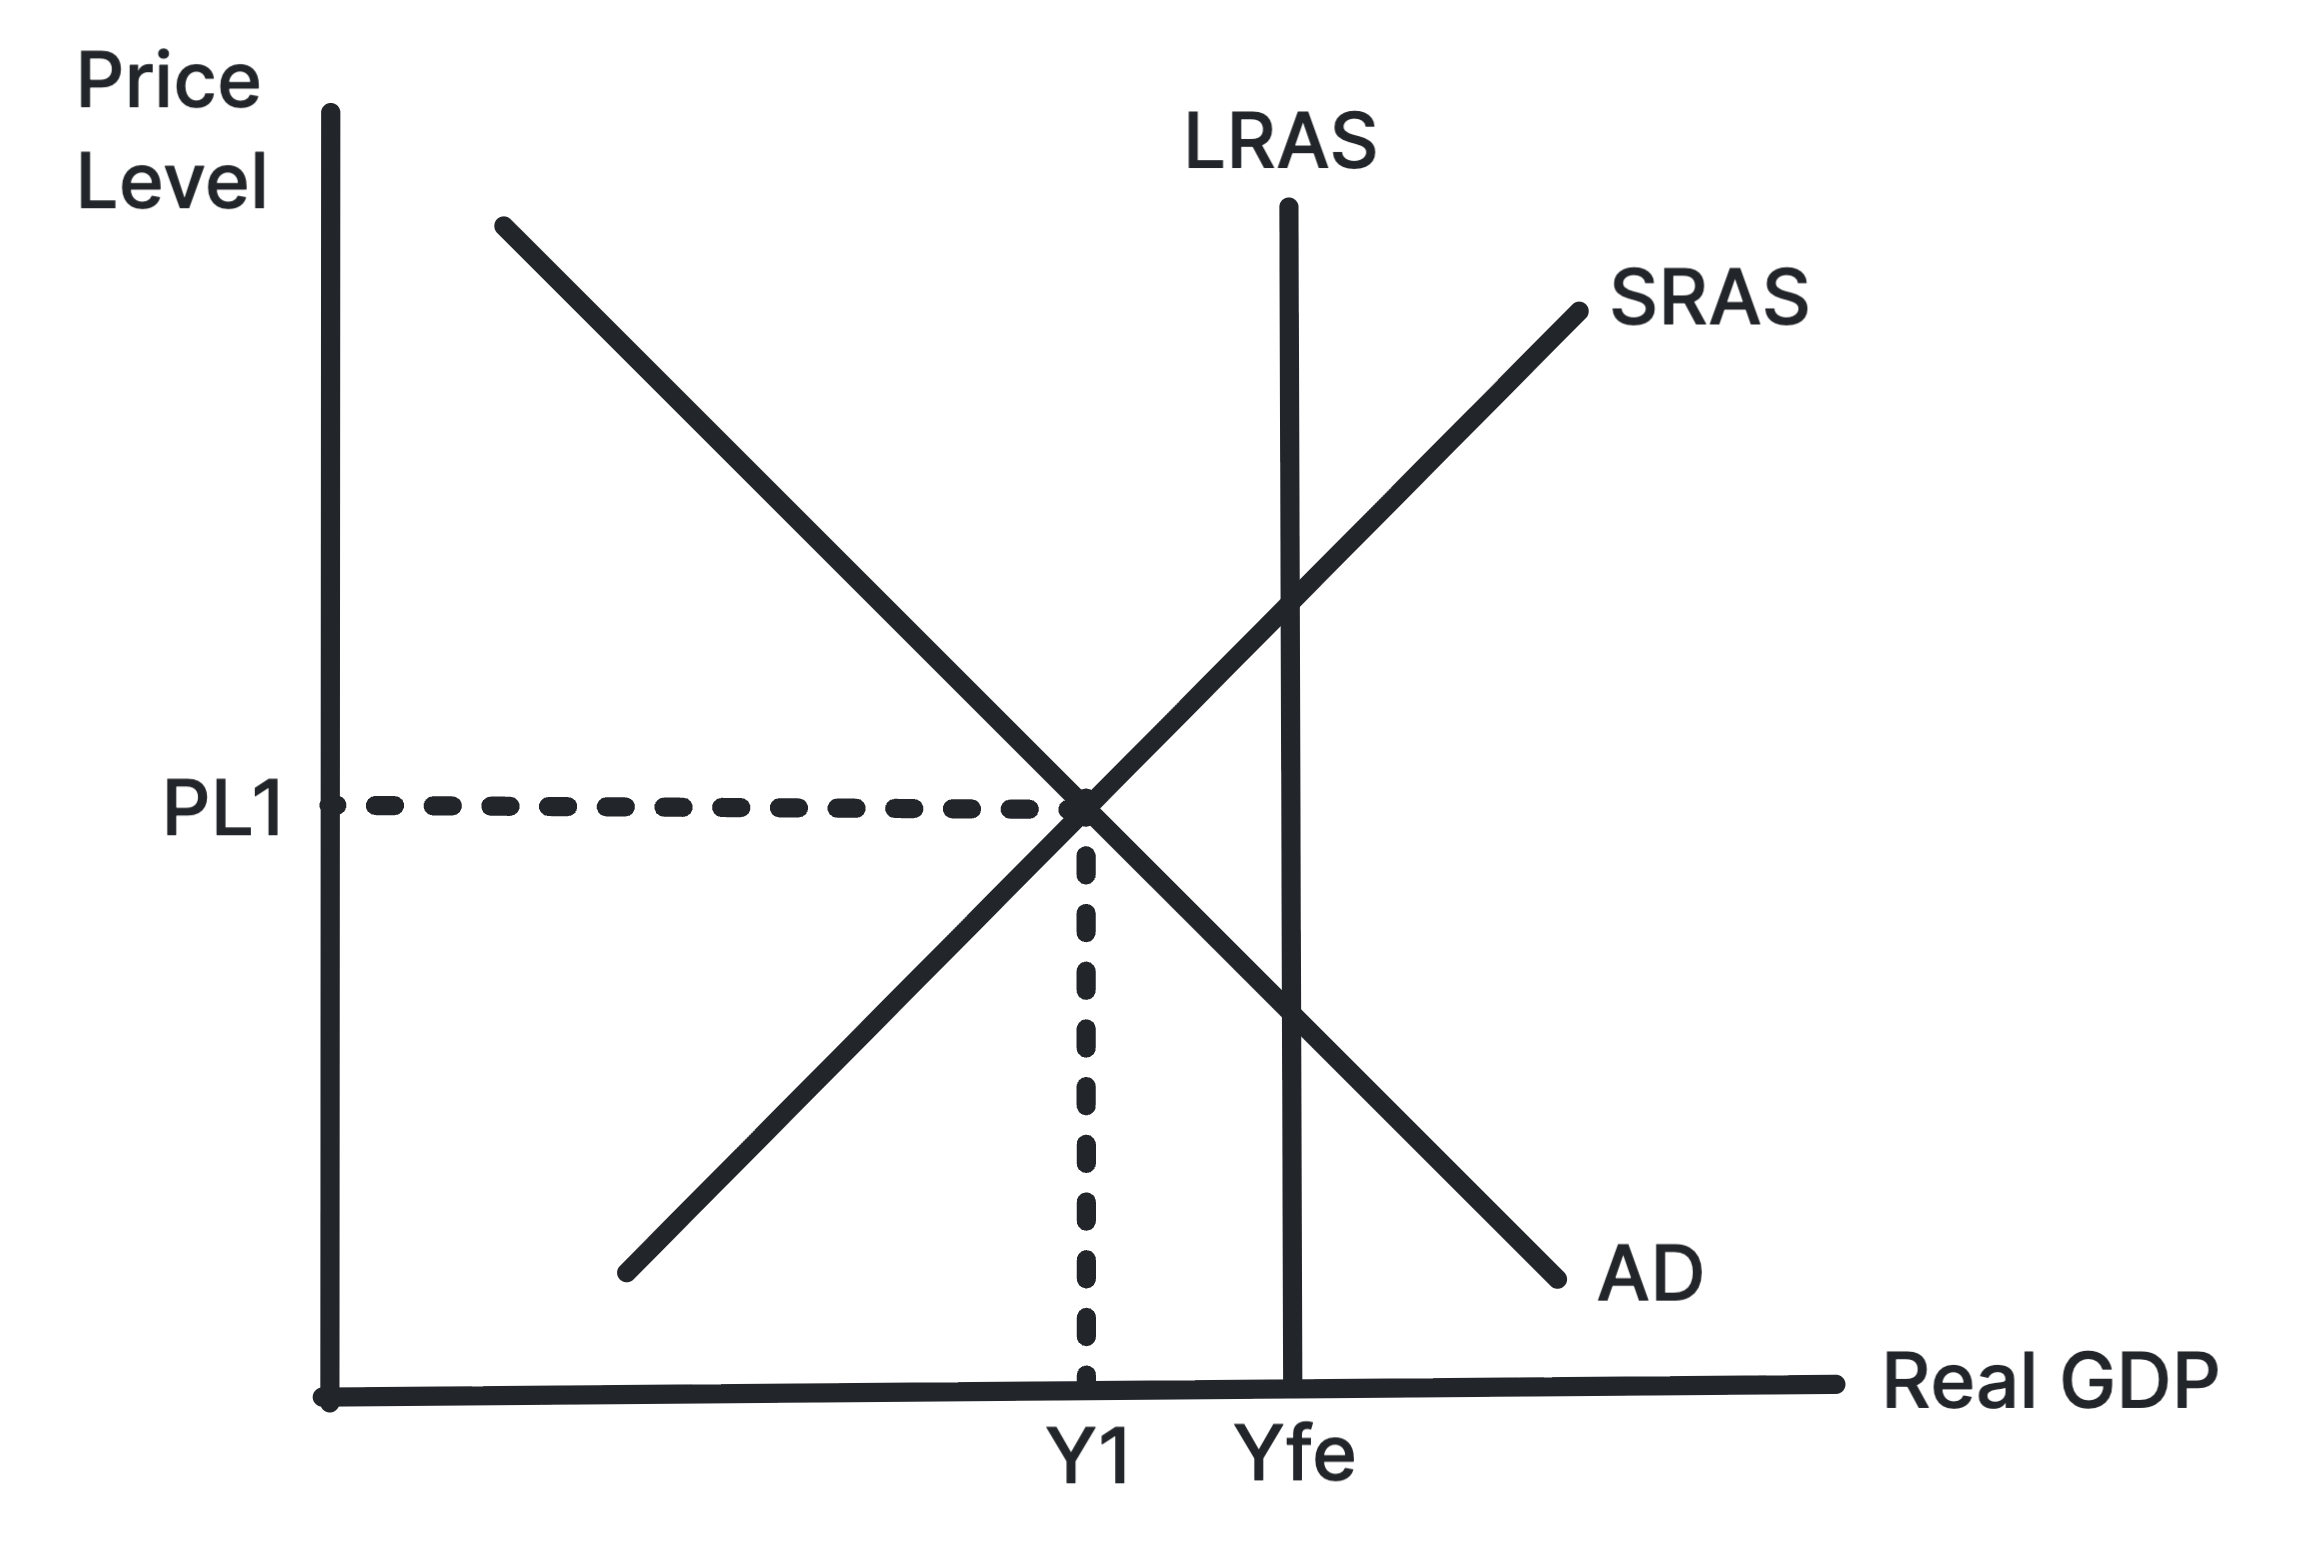
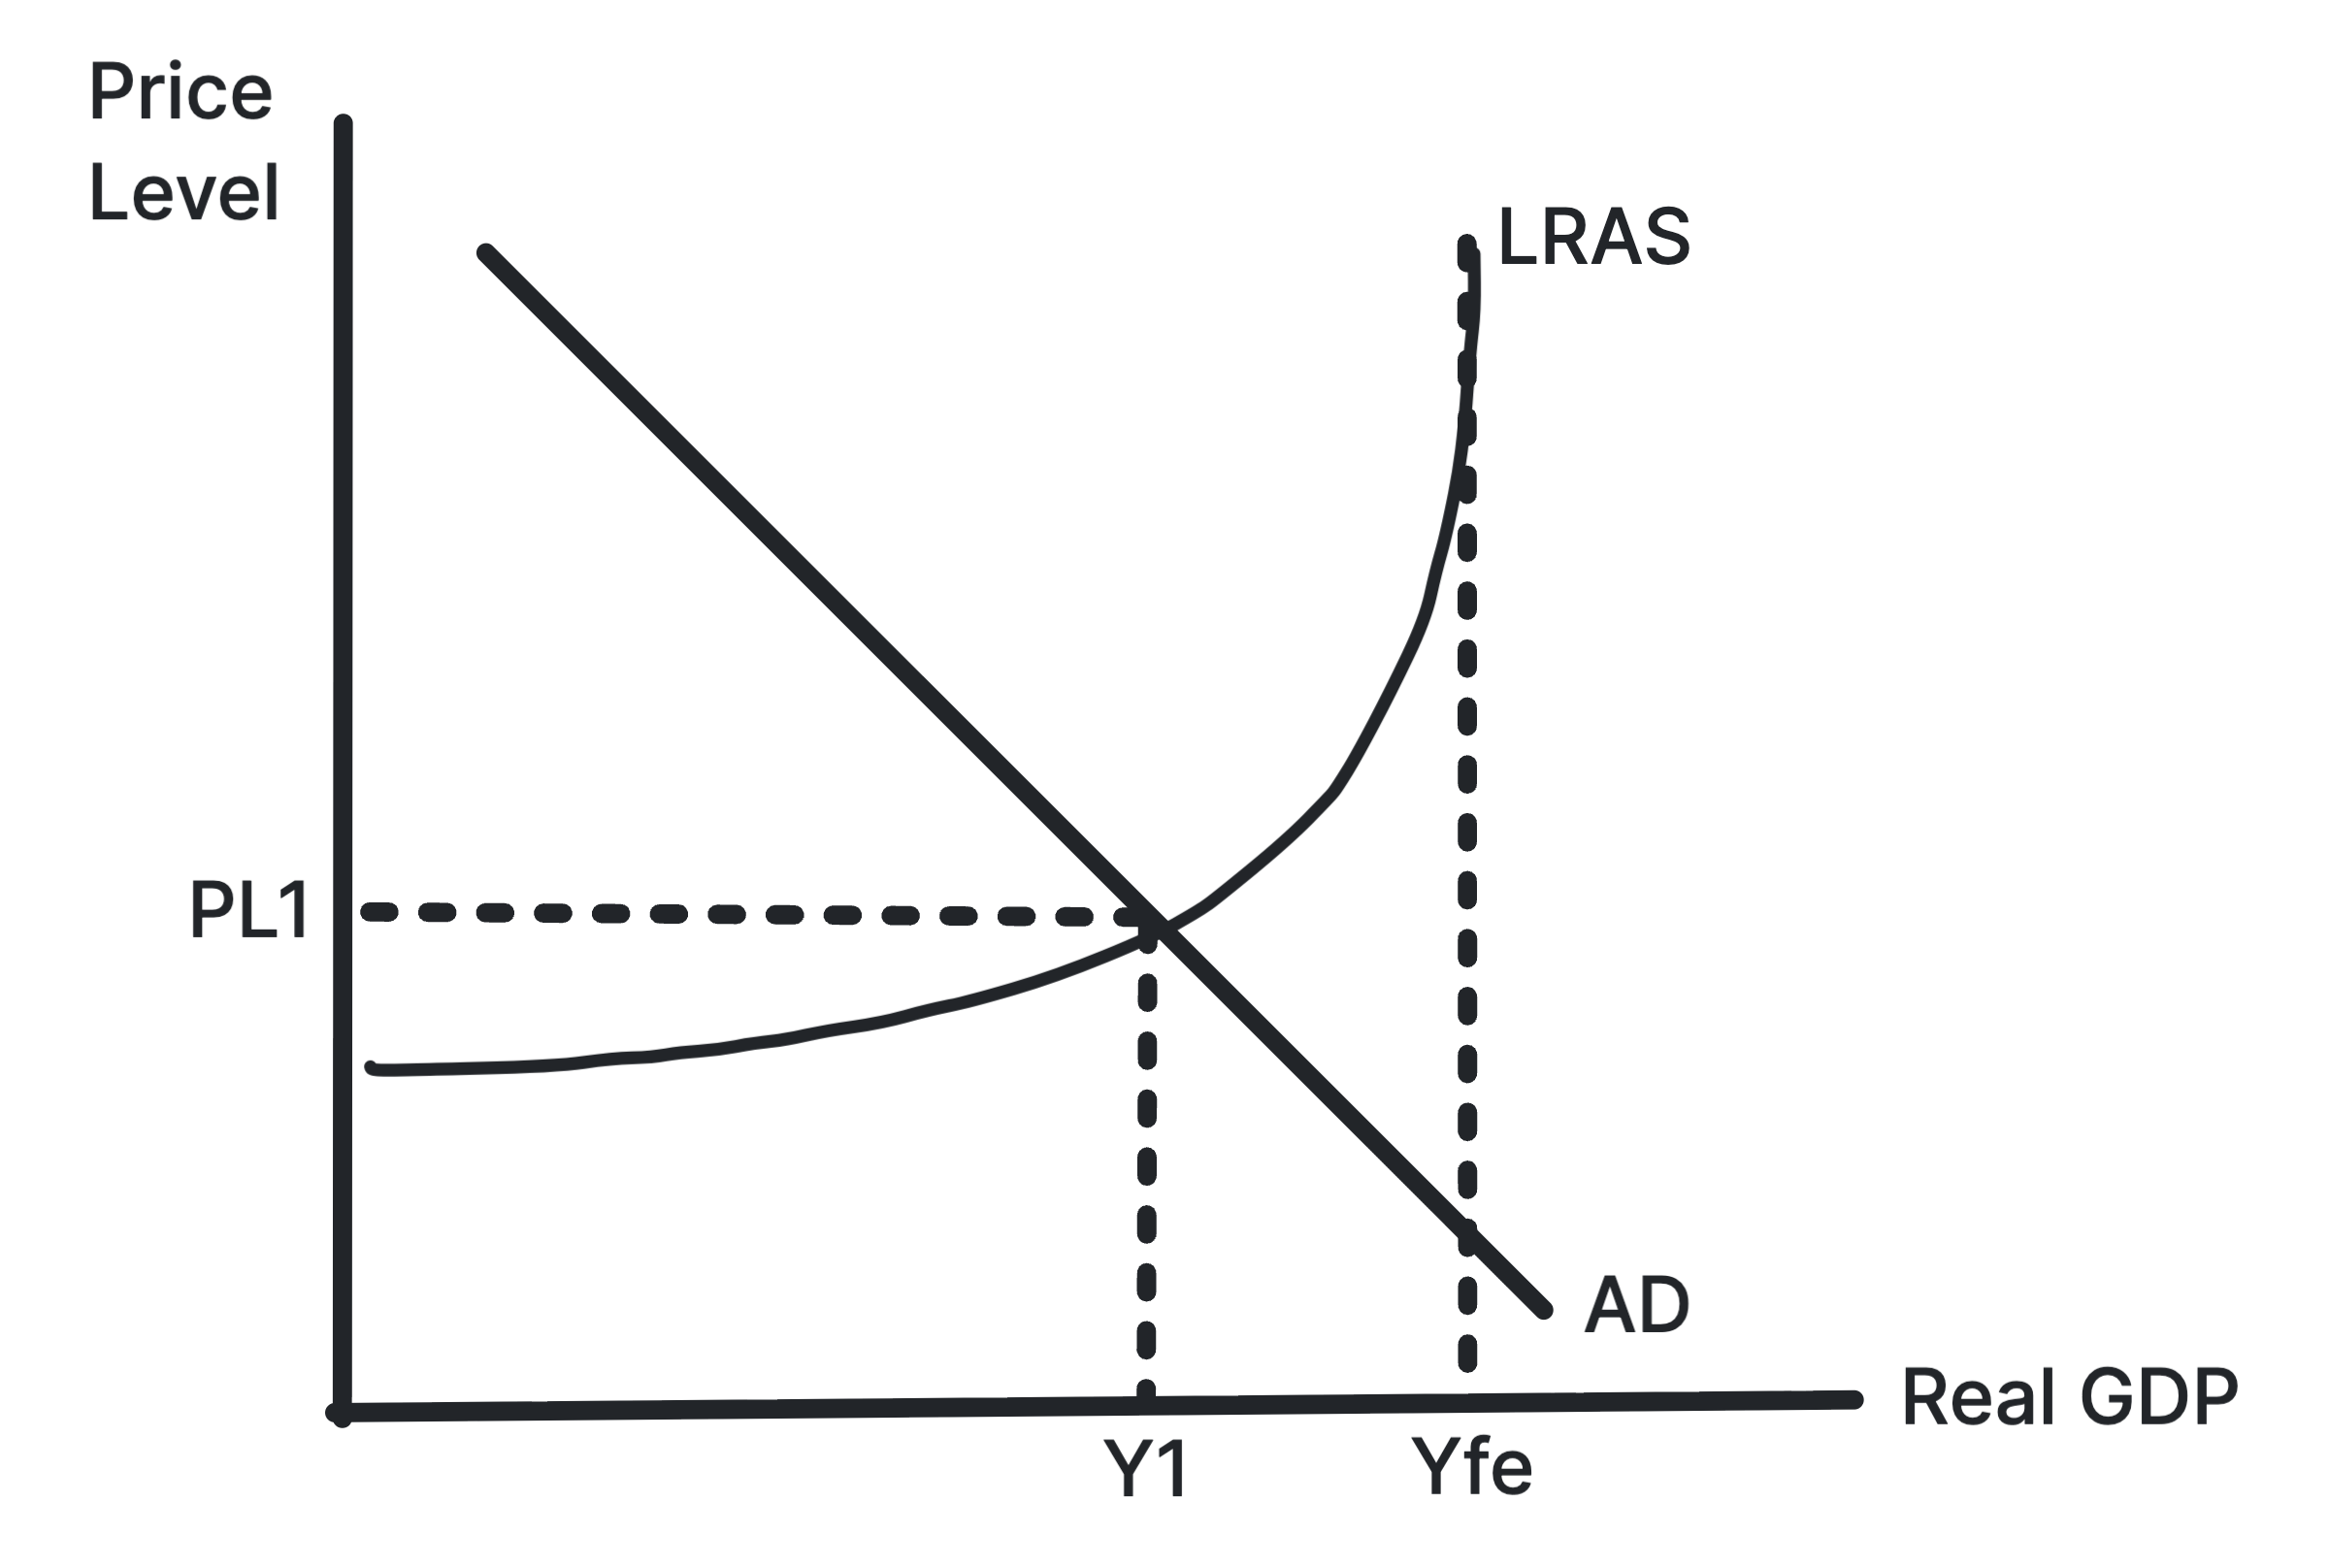
A negative output gap, also called a recessionary gap, occurs when actual GDP is less than potential GDP.
Characteristics: Spare capacity, unemployment of resources, especially cyclical unemployment, and weak inflationary pressure or even deflationary pressure.
Cause: This is typically caused by a deficiency of aggregate demand.
This can be shown on both a Classical and Keynesian AD/AS diagram, where the economy is producing at a level of output below the full employment level of output (Yfe).
Positive Output Gap
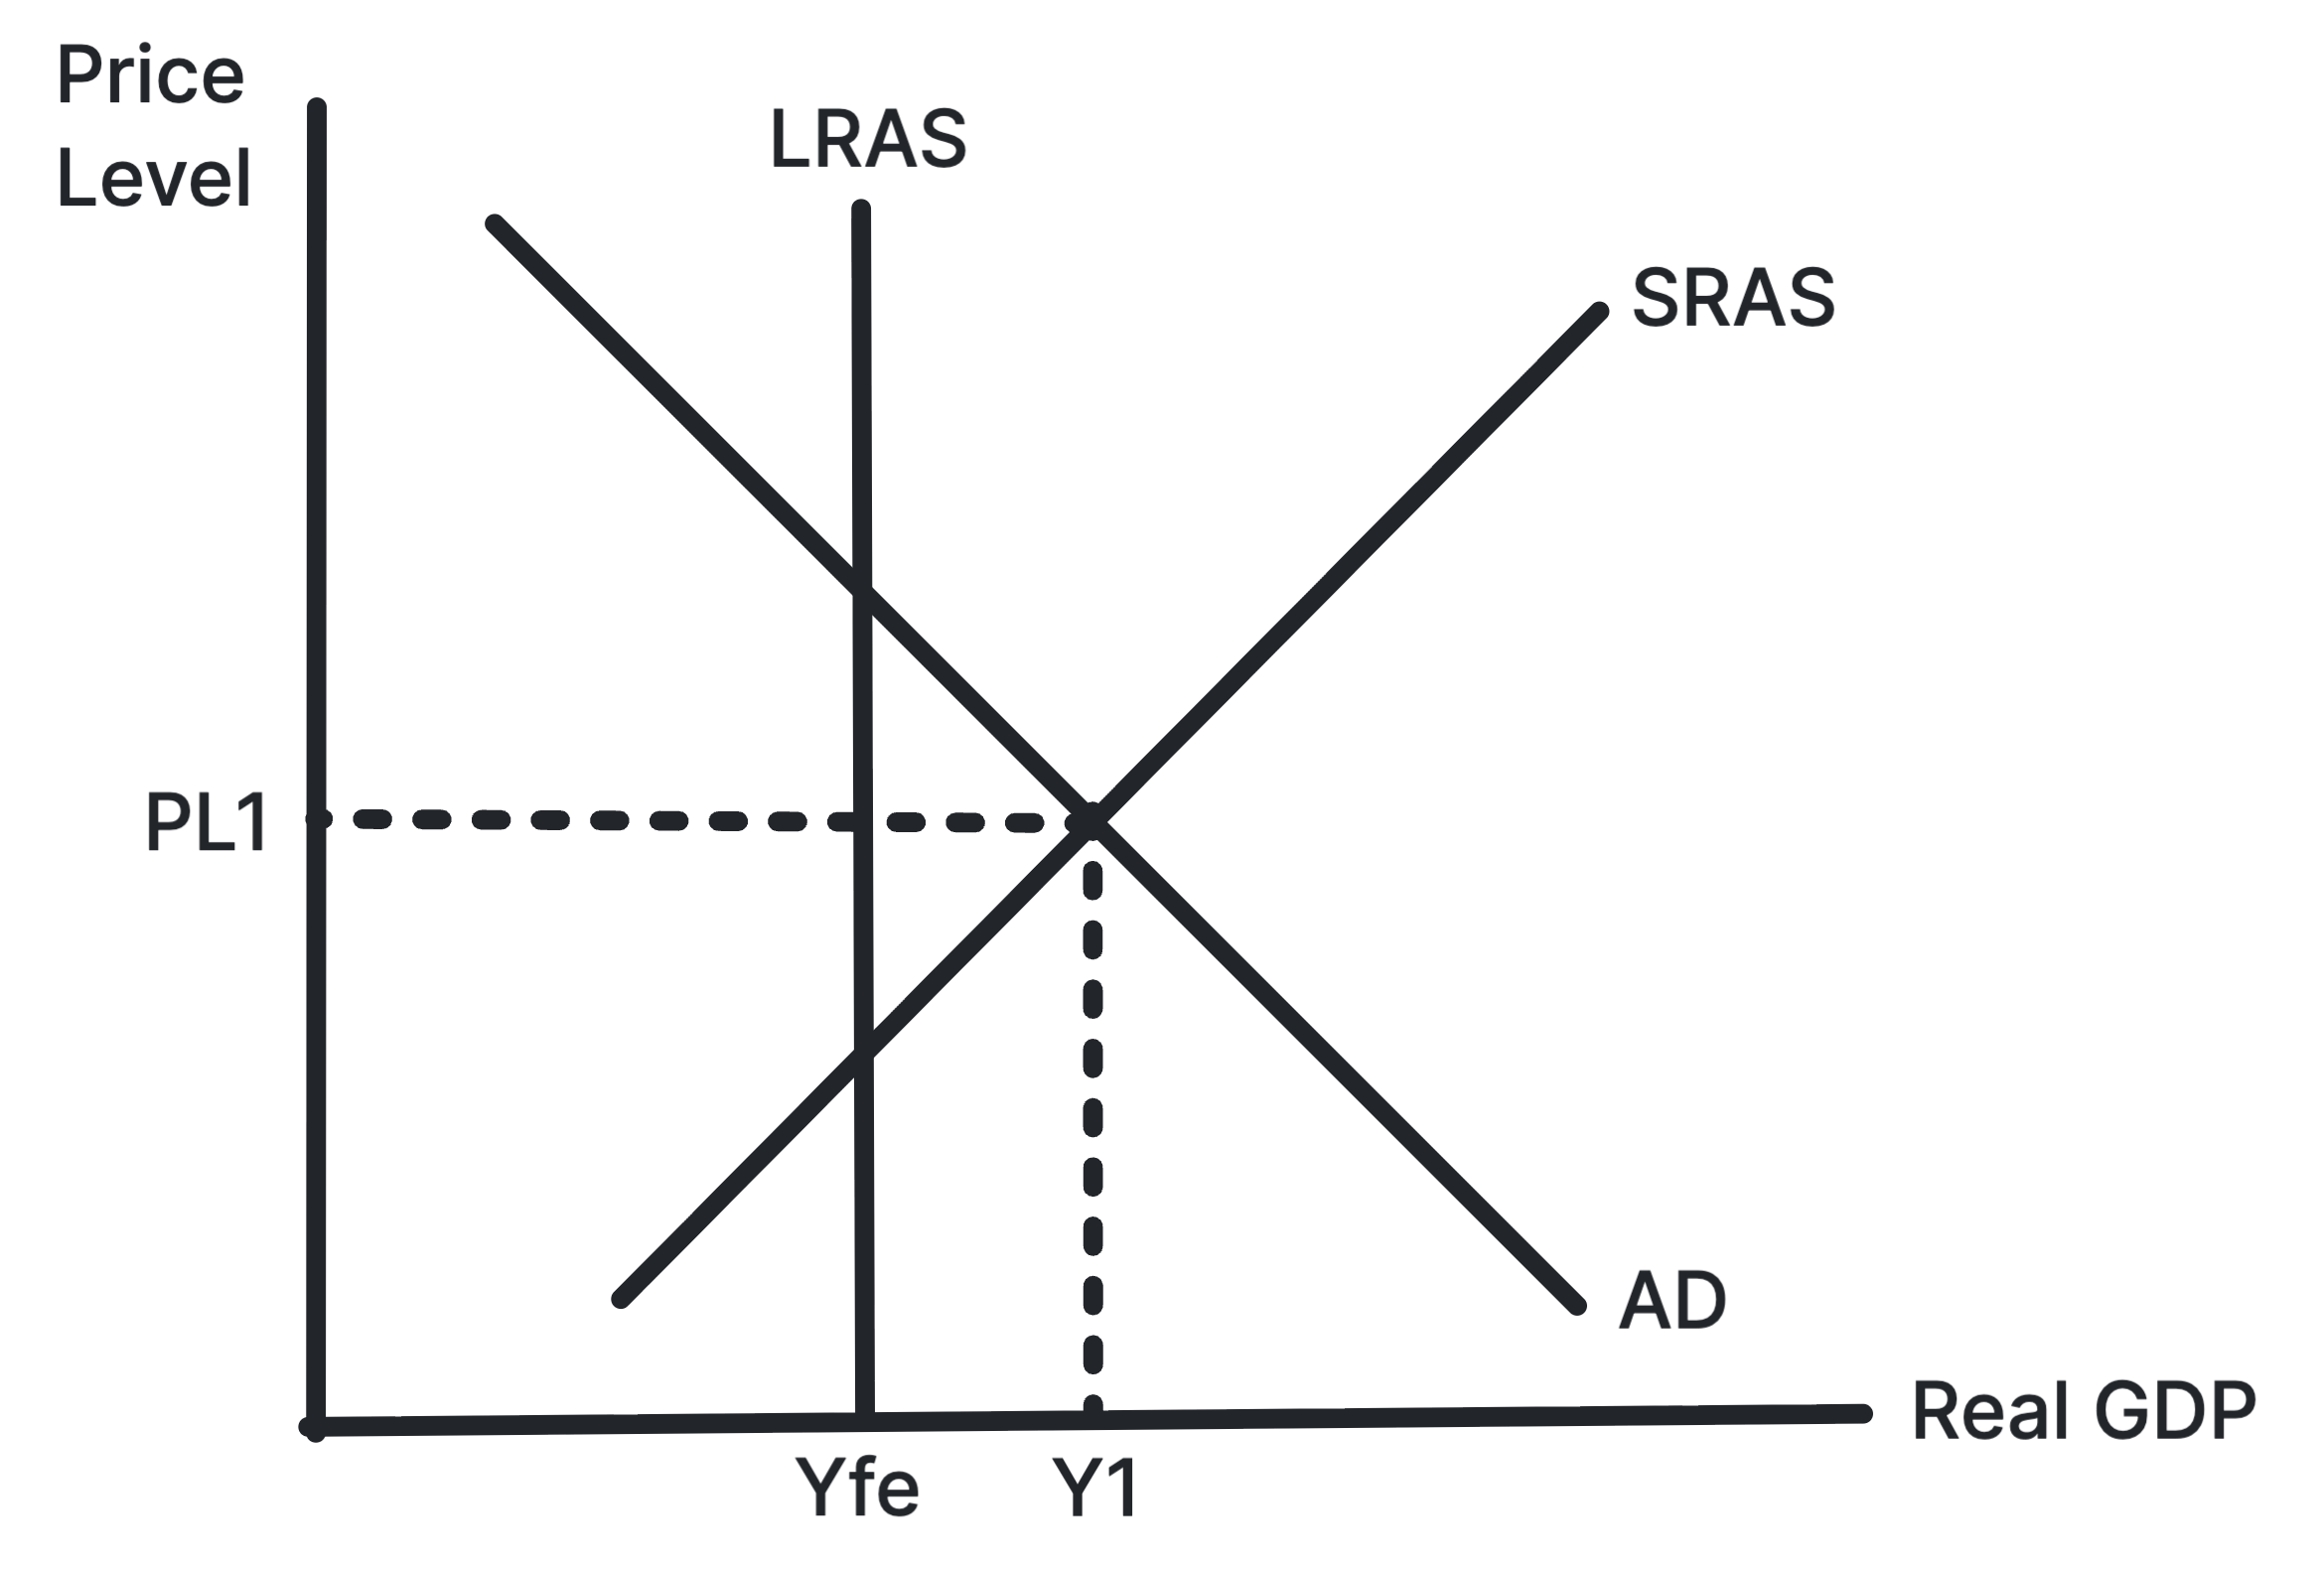
A positive output gap, also called an inflationary gap, occurs when actual GDP is greater than potential GDP.
Characteristics: Resources are used unsustainably, for example through excessive overtime or overuse of machinery, leading to demand-pull inflation, labour shortages, and possible current account problems.
Cause: This is usually caused by excessive aggregate demand.
This can only be shown on a Classical AD/AS diagram, where the economy is producing at a level of output above the full employment level of output (Yfe).
The Role of Economic Views
Classical View: Output gaps are temporary. The economy self-corrects through price and wage flexibility. A negative output gap encourages falling prices and wages, while a positive output gap creates rising costs that reduce supply.
Keynesian View: The economy can be stuck in a negative output gap because of low confidence and sticky wages and prices. Government intervention is therefore needed to raise aggregate demand and close the gap.
Difficulties in Measuring Output Gaps
Measuring the size of an output gap is difficult because potential GDP is not directly observable. Economists must rely on estimates and models, which can vary significantly. Changes in technology, labour force participation, and capital stock can also affect potential output, making it challenging to determine the exact size of the gap.
Stuck on this topic? Work through it with an online A-Level Economics tutor in a free 15-minute intro call, or send an essay on it for A-Level Economics essay marking.