Written by
Eliot King— First-Class BSc (Hons) Economics, University of Bath · 6+ years teaching A-Level Economics · Edexcel A, Edexcel B, AQA and OCR
Specification Coverage: Edexcel unit 2.5.1 -
Causes of Growth. Students should be able to understand and
explain the difference between actual and potential growth,
distinguish between short-run and long-run growth, identify the
factors that cause long-run supply-side growth, and analyse the
concept of export-led growth. These notes also cover demand-side
causes of growth and the use of AD/AS diagrams to illustrate it.
Actual vs. Potential Growth
Actual Growth: An increase
in real GDP over time. It is measured by the
percentage change in the actual output of goods
and services.
Potential Growth: An
increase in the economy's productive capacity.
This is the maximum possible output the economy
could produce if all resources were fully employed.
Short-Run Economic Growth
Cause: An increase in
aggregate demand (or SRAS).
This may be triggered by a rise in any component of AD:
consumption, investment, government spending, or net exports.
Result: The economy moves
closer to its existing productive potential,
which can be shown as moving from inside the PPF towards the
frontier.
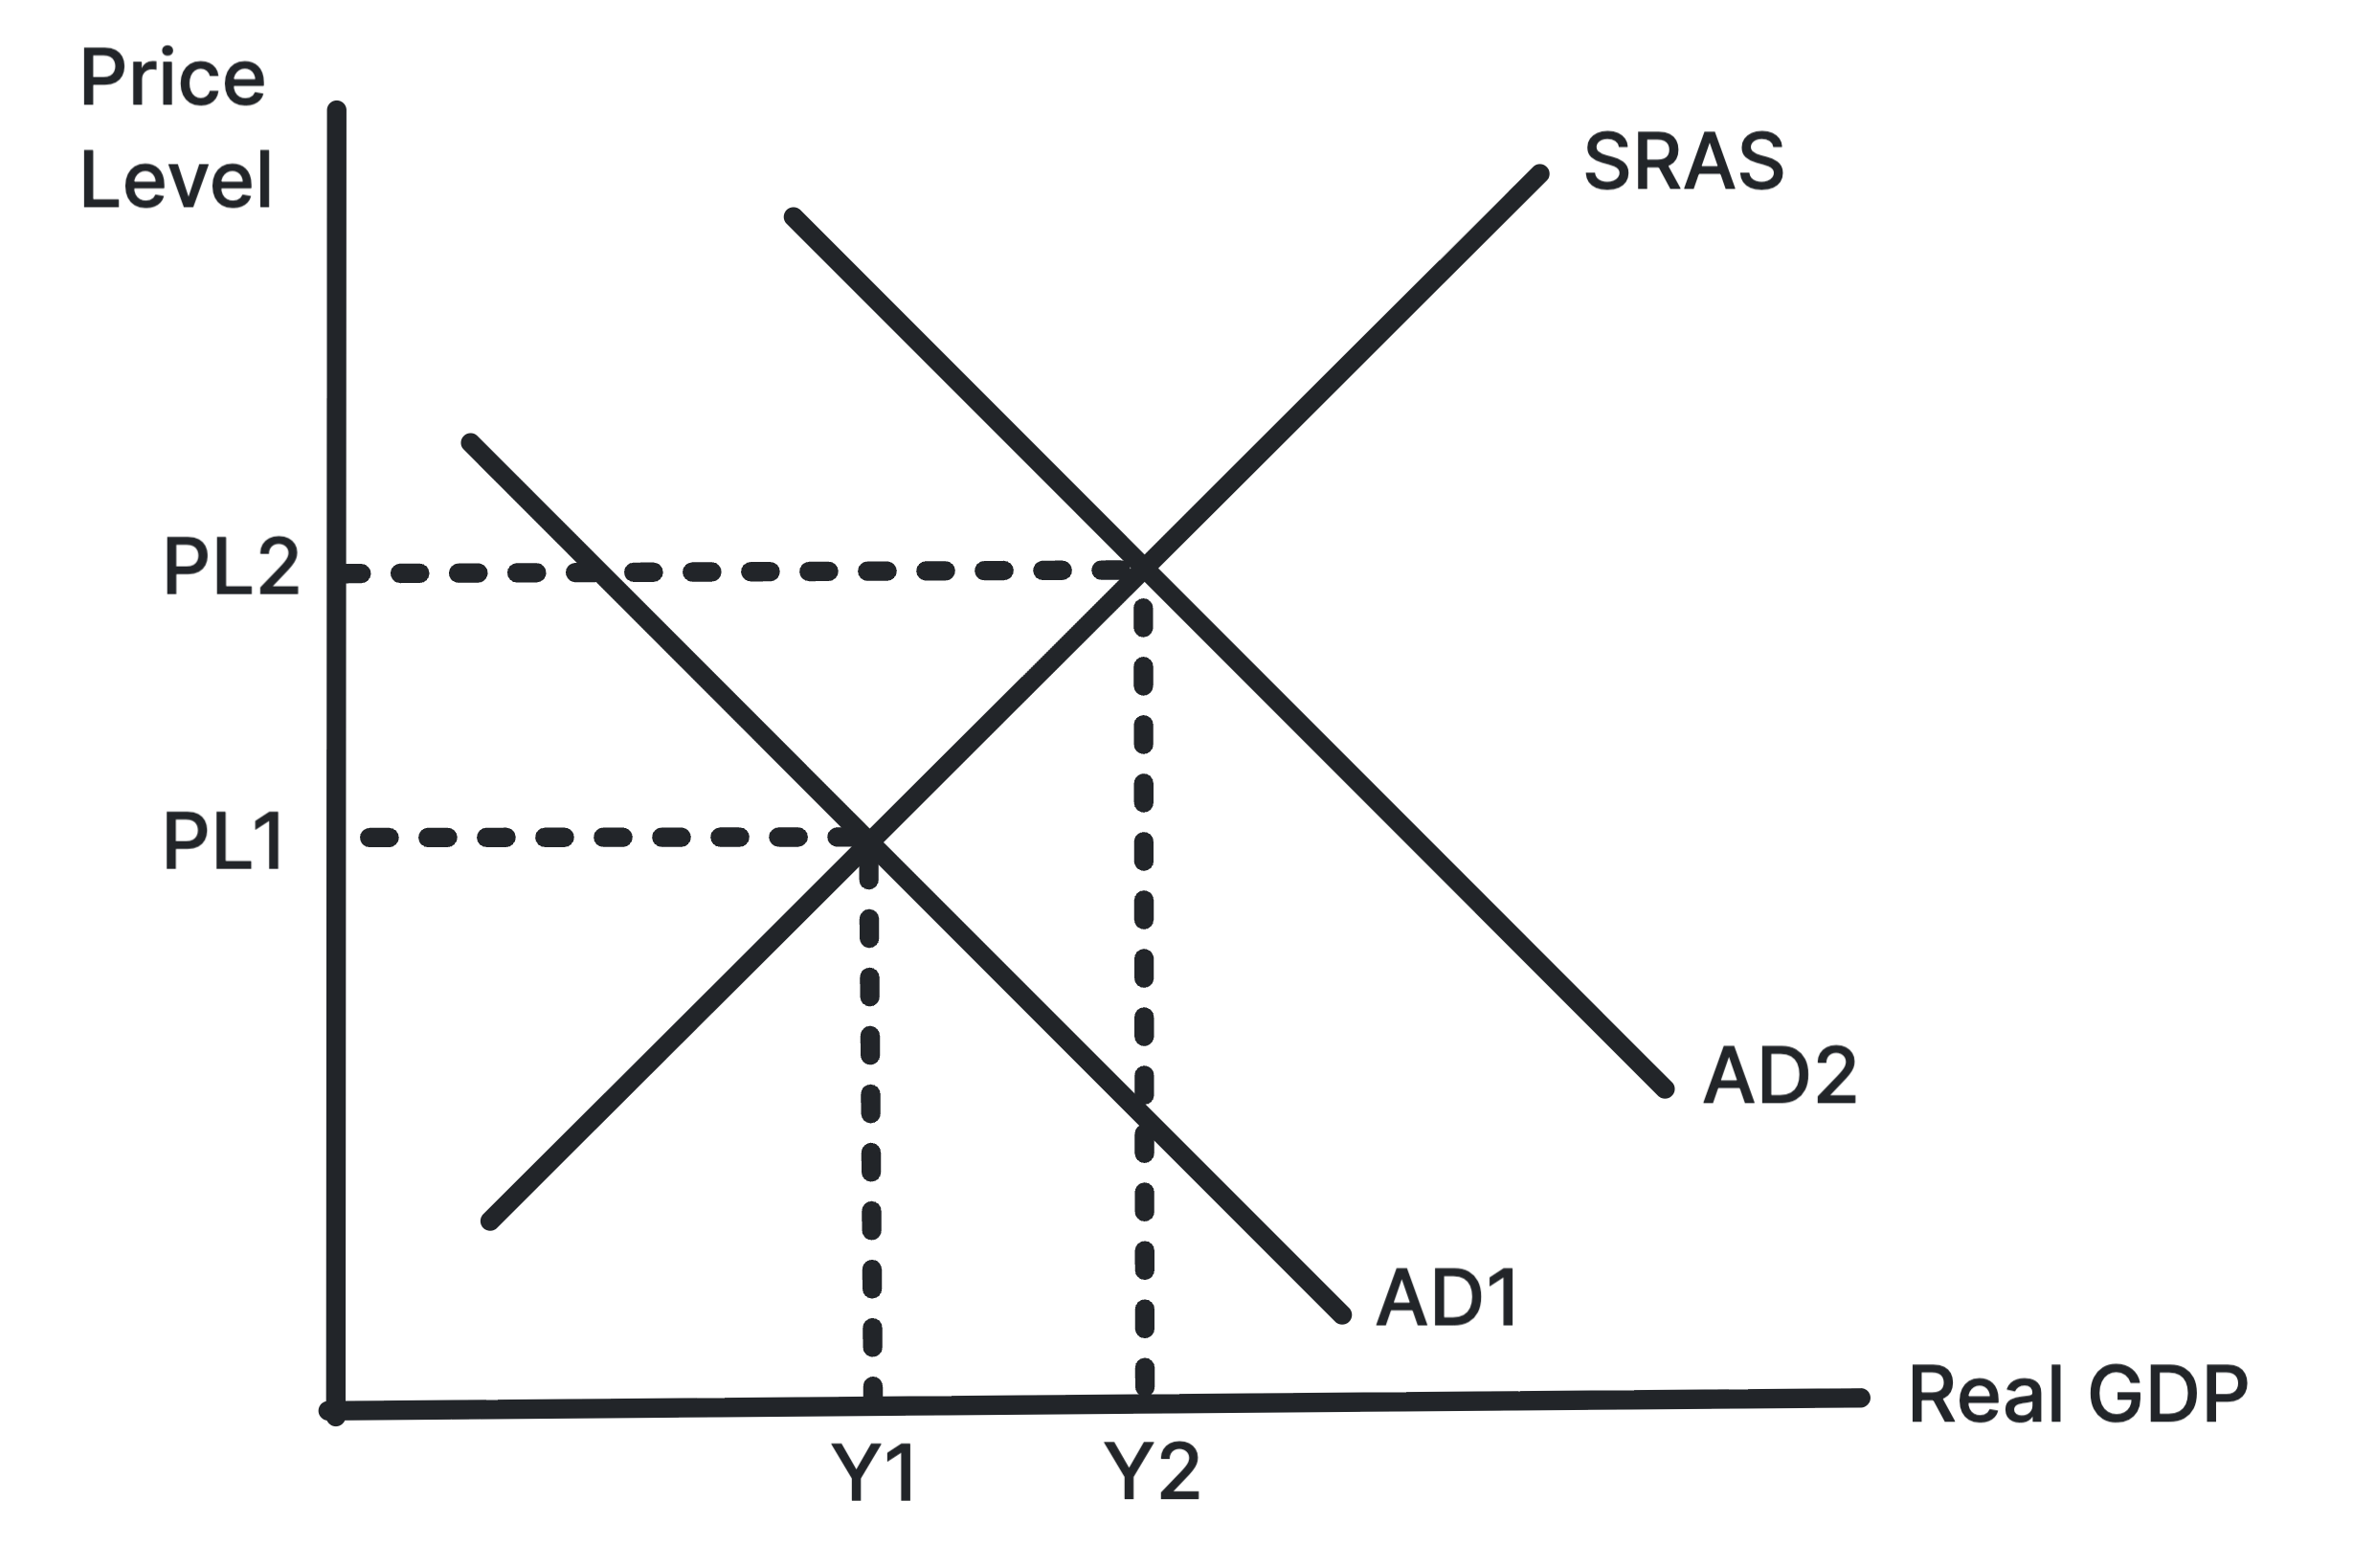
Figure 1: Short-Run Growth on AD/AS Diagram. An increase in
aggregate demand (AD) from AD1 to AD2 leads to a higher real
GDP (Y1 to Y2) and a higher price level (P1 to P2) in the
short run. This represents actual growth as the economy moves
closer to its productive potential, but it does not increase
the long-term capacity of the economy.
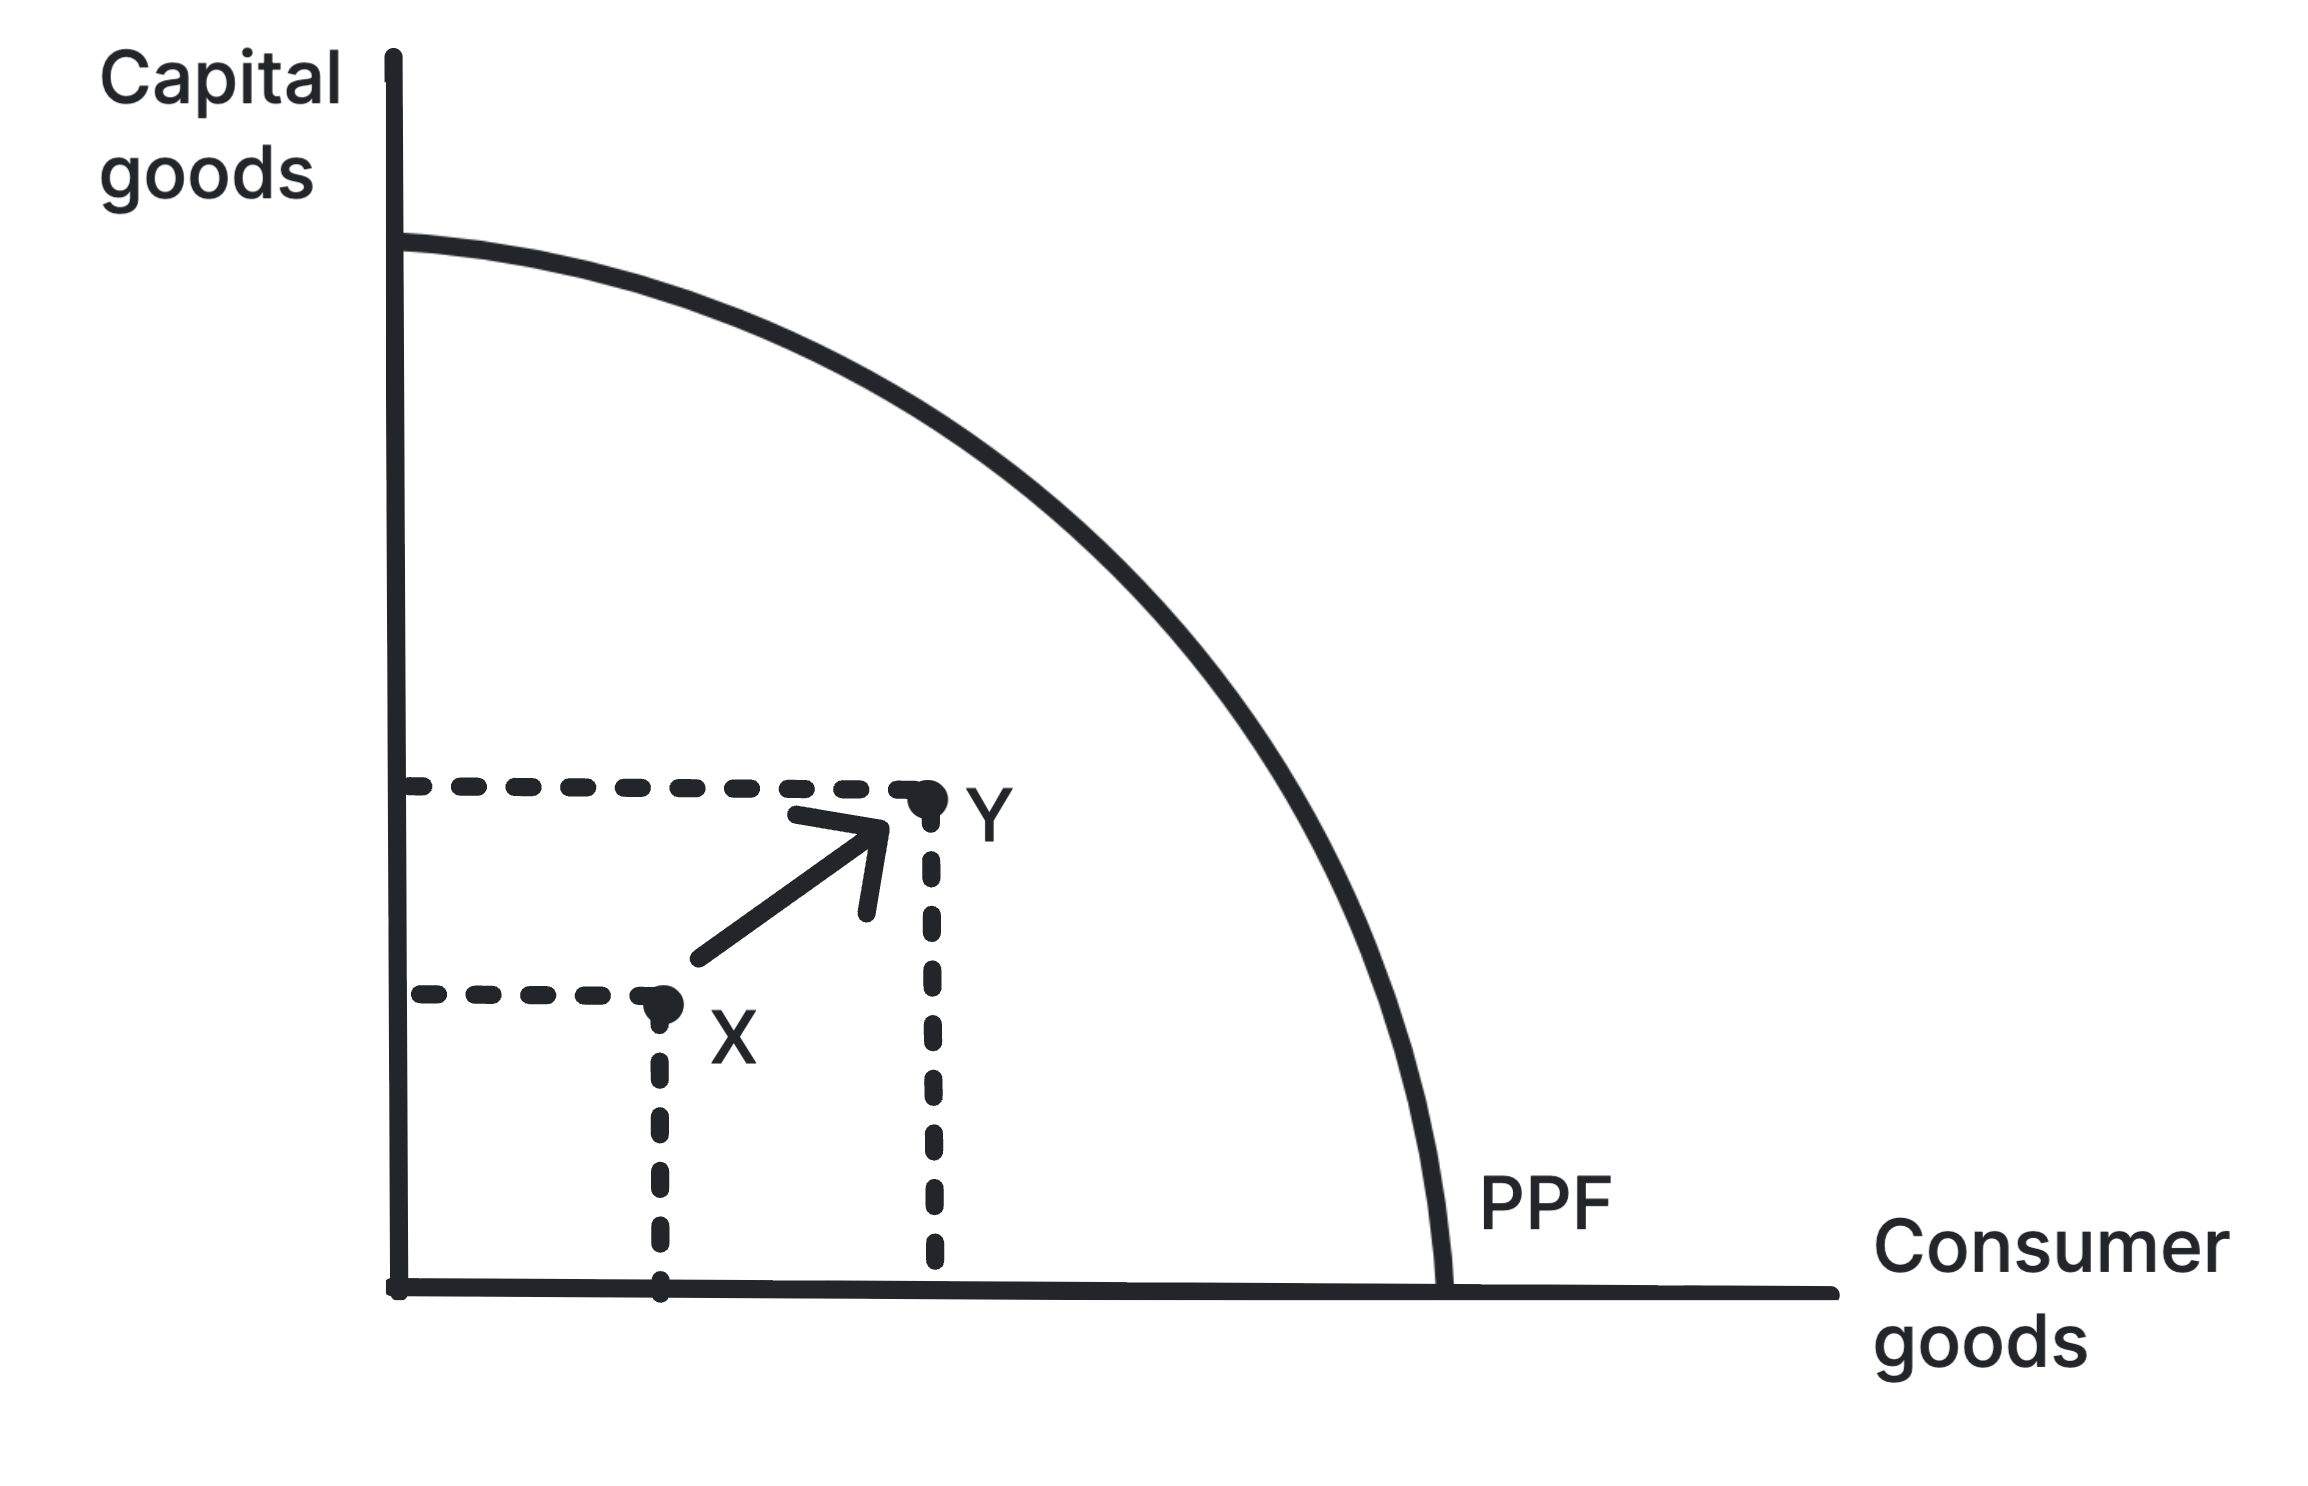
Figure 2: Short-Run Growth on PPF Diagram. The economy moves
from point X, which is inside the PPF, to point Y, which is
closer to the frontier. This represents actual growth as the
economy utilises more of its existing resources, but the PPF
itself does not shift, indicating that potential output has
not increased.
Long-Run Economic Growth
Cause: An increase in the
quality or quantity of the factors of
production, including land, labour, capital, and enterprise.
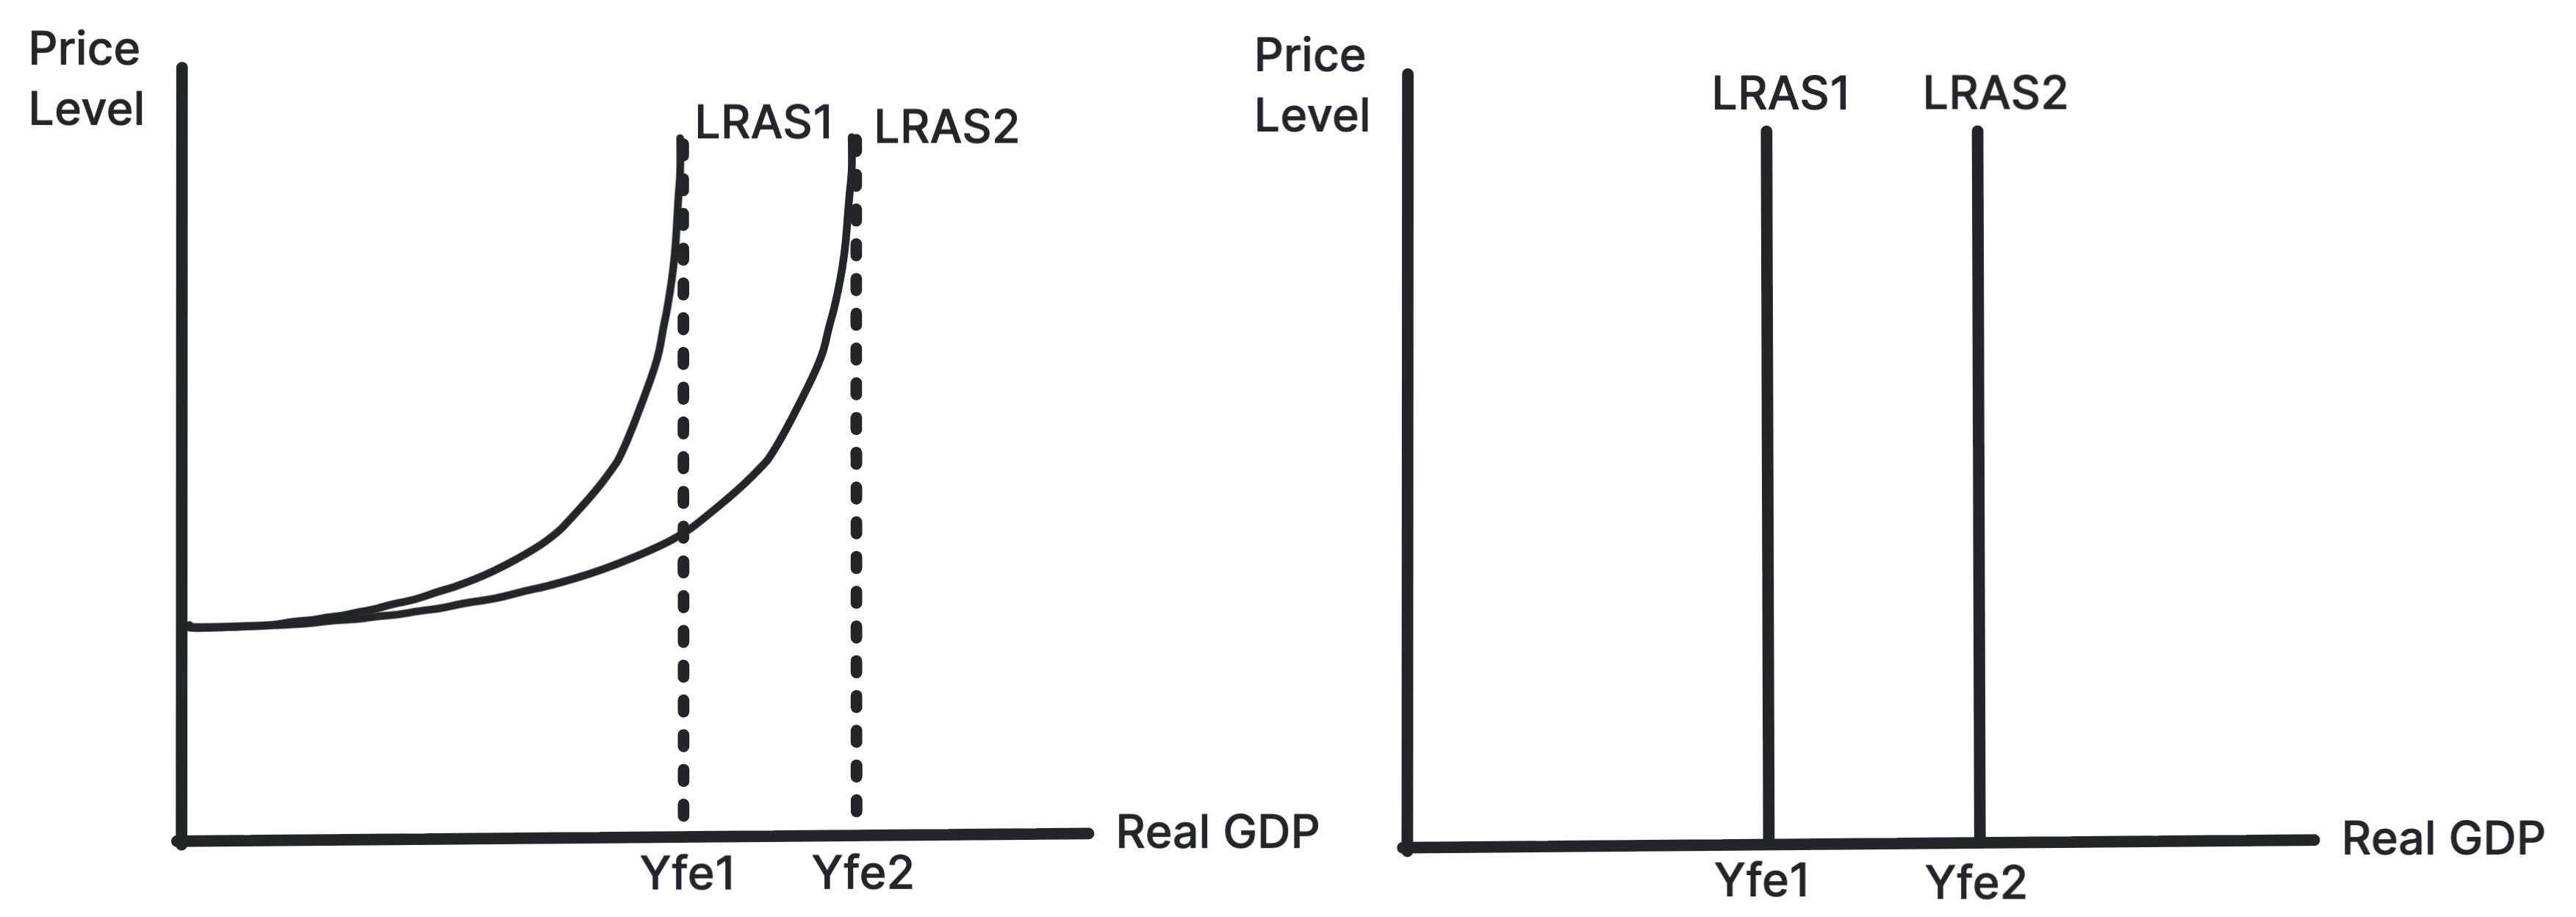
Figure 3: Long-Run Growth on AD/AS Diagram. An outward shift
in the LRAS curve from LRAS1 to LRAS2 represents an increase
in the economy's productive potential. This allows for a
higher level of real GDP (Y1 to Y2) without causing
inflationary pressure, as the economy can produce more goods
and services at the same price level (P1).
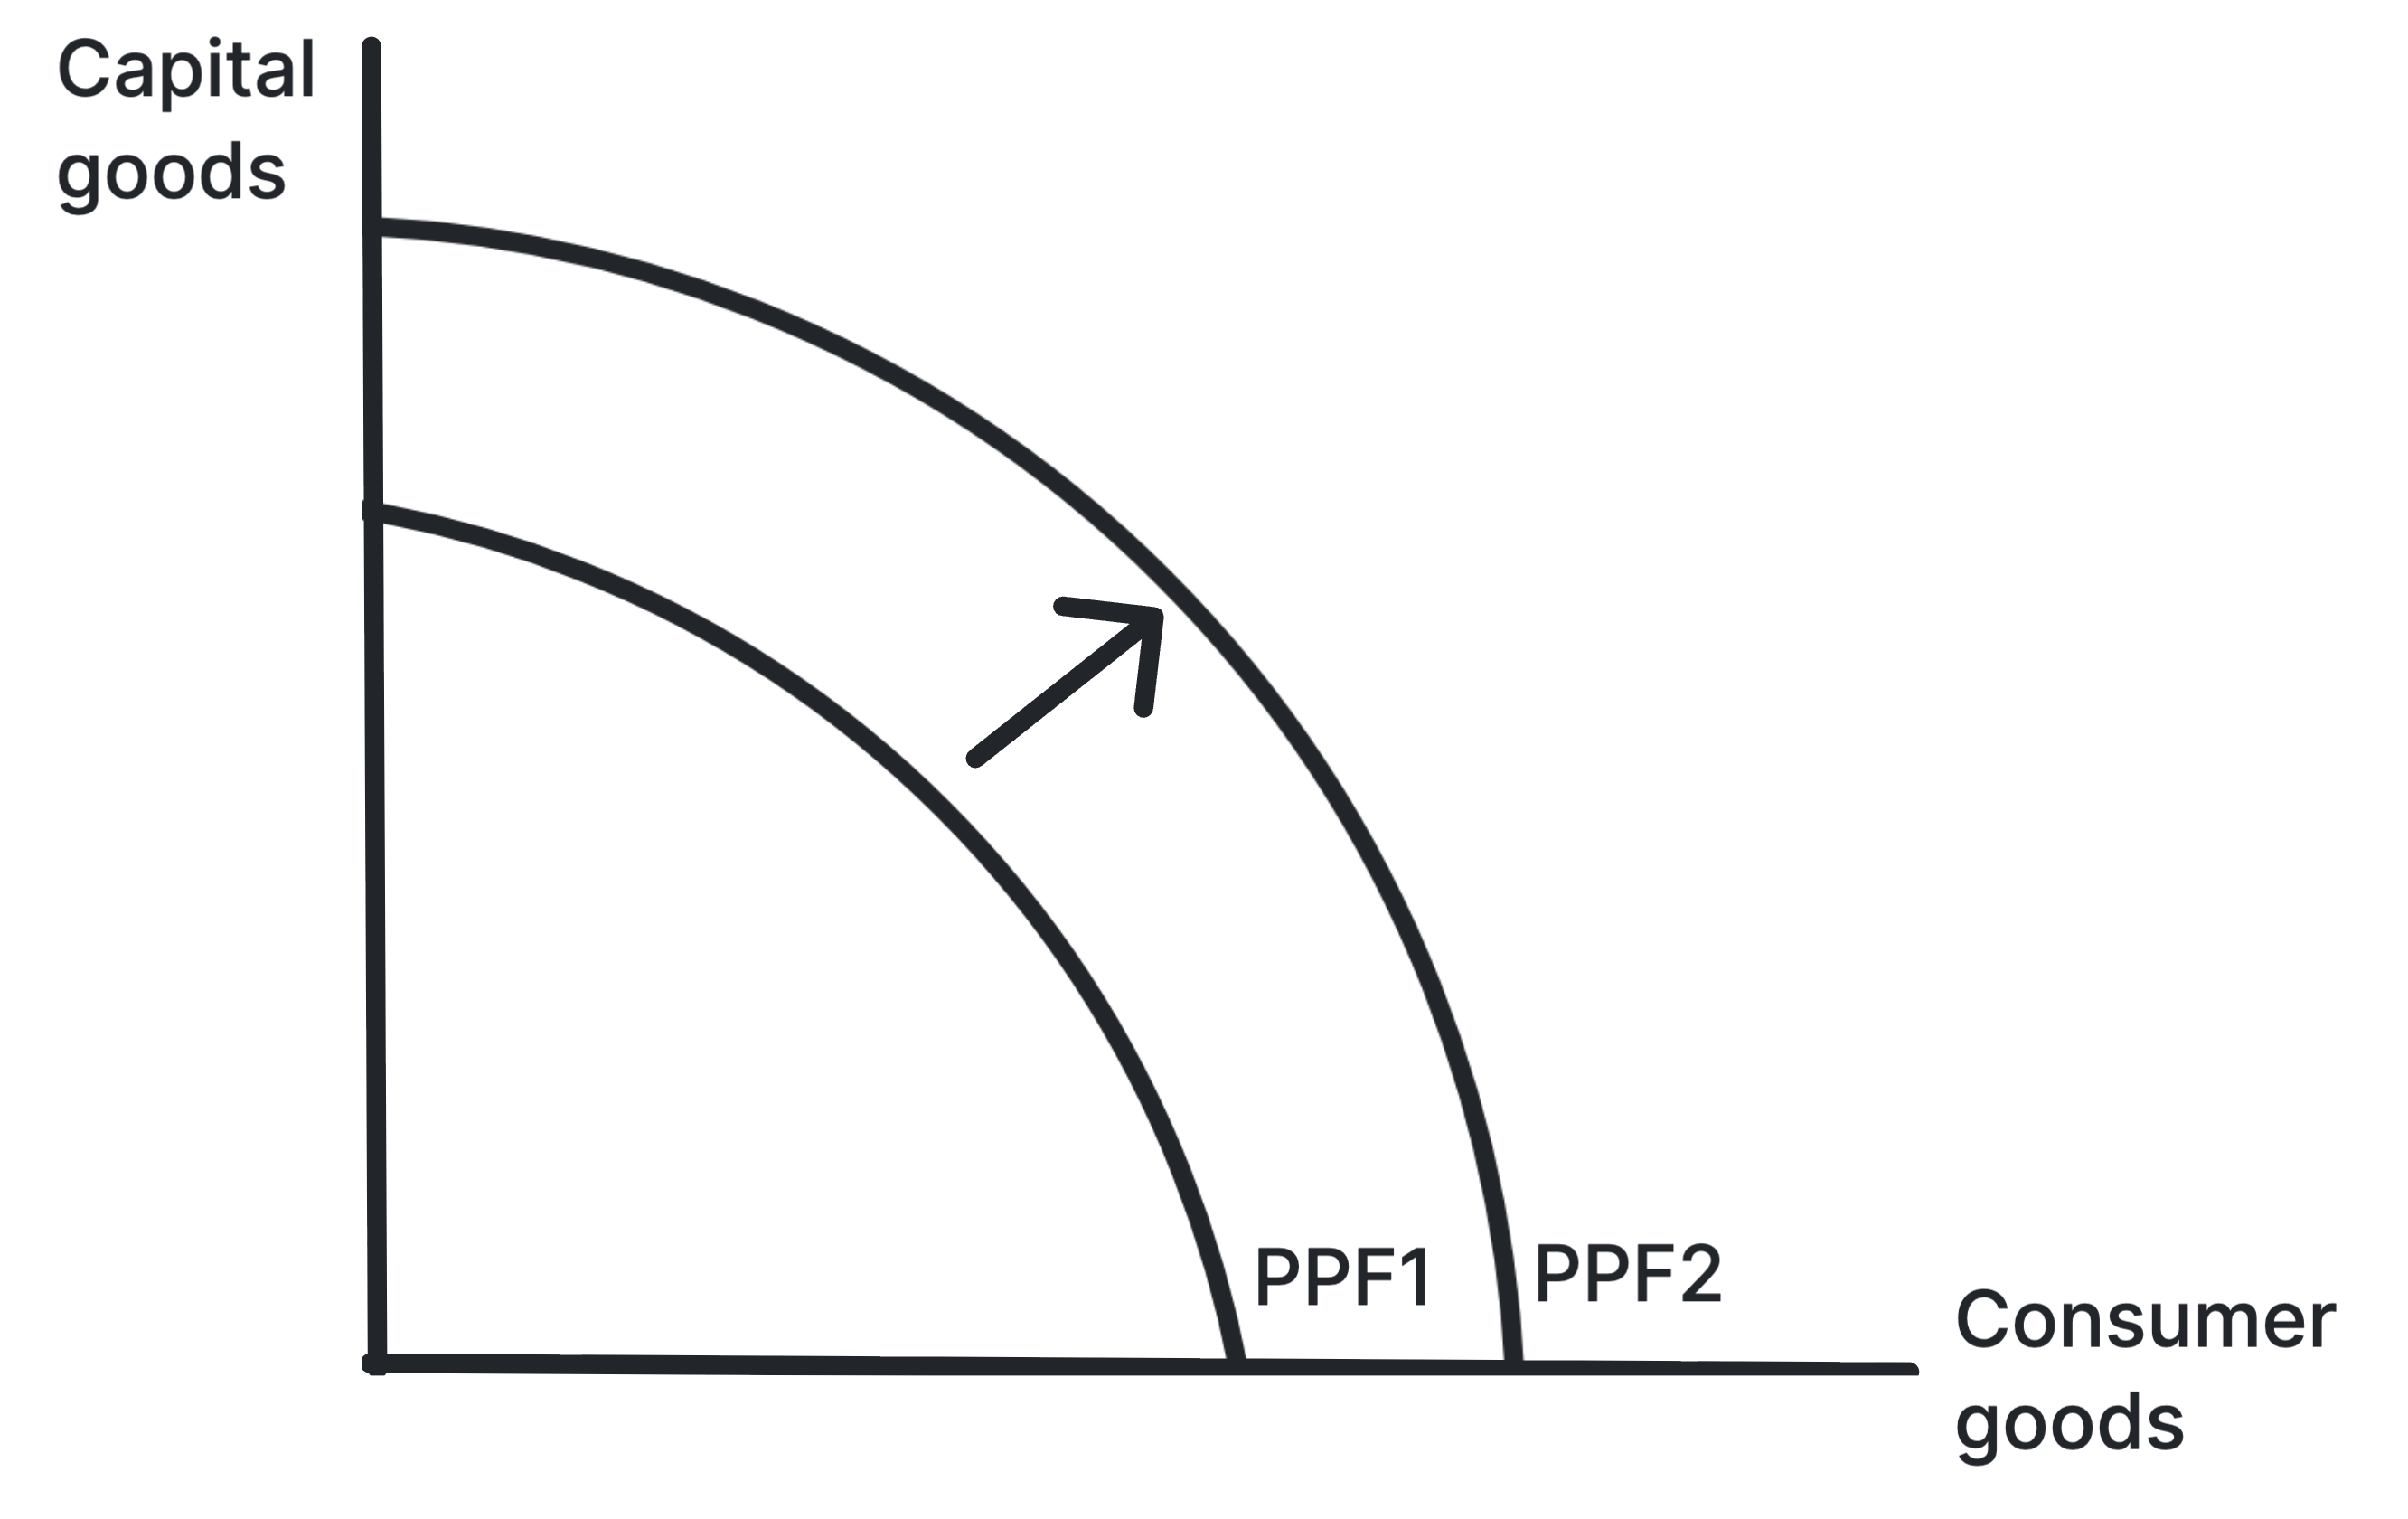
Figure 4: Long-Run Growth on PPF Diagram. The production
possibility frontier shifts outward from PPF1 to PPF2,
indicating an increase in the economy's productive potential.
The economy can now produce more of both goods without
sacrificing the production of either good, which represents
sustainable long-term growth.
Factors Causing Long-Run Growth
These factors shift the LRAS curve outwards.
Factor
How It Increases Potential Output
Technological Advances
Improve the quality of capital and make production more
efficient.
Investment in Capital
Increase the quantity and quality of physical capital,
such as machinery and infrastructure.
Improvements in Human Capital
Improve the quality of labour through better education,
training, and healthcare.
Demographic Changes
Increase the quantity of labour through population
growth or positive net migration.
Increased Competition and Enterprise
Create more efficient markets and encourage innovation.
Institutional Improvements
Better legal systems, property rights, and political
stability encourage investment and growth.
Export-Led Growth
Concept: A strategy where economic growth is
mainly driven by a
sustained increase in exports.
Mechanism: Rising exports directly increase
aggregate demand in the short run. The income and investment
generated can then help to improve productive capacity in the
long run.
Example: China's rapid growth from the 1990s to
the 2010s was strongly linked to export-led development.
Risks: Export-led growth can make an economy
too dependent on global demand and more vulnerable to external
shocks.