Demand-Side Policies
Fiscal and Monetary Policy
Demand-side policies: policies that change the level of aggregate demand (AD) to steer growth, unemployment and inflation.
There are two kinds, run by different bodies. The government runs fiscal policy; the Bank of England runs monetary policy.
Fiscal Policy
Fiscal policy: the use of government spending and taxation to influence aggregate demand.
Government spending on schools, hospitals and roads adds to AD directly. Taxes take money out of the economy, and come in two types:
- Direct taxes are taken from income and profit, such as income tax, National Insurance and corporation tax.
- Indirect taxes are added to spending, such as VAT and fuel duty.
Expansionary fiscal policy means more spending or lower taxes, and shifts AD right. Contractionary fiscal policy does the opposite. If spending is greater than tax revenue, the government runs a budget deficit and borrows the difference.
Monetary Policy
Monetary policy: the use of interest rates and the money supply to influence aggregate demand, mainly to control inflation.
Since 1997 the Bank of England has set monetary policy independently of the government. Its Monetary Policy Committee (MPC) has nine members and decides policy eight times a year. Its job is to keep CPI inflation at the government's 2% target. It has two tools.
Interest rates. The MPC sets Bank Rate, which banks' own rates on loans, mortgages and savings follow. A cut lifts AD:
- Households: Bank Rate falls → mortgage and loan repayments fall and saving pays less → more income left to spend → consumption rises.
- Firms: borrowing is cheaper → more investment projects are worth funding → investment rises.
- Exporters: lower rates make UK savings less attractive to foreign investors → the pound weakens → UK goods cost less abroad → exports rise.
Quantitative easing. When Bank Rate is already close to zero, the Bank can buy assets instead. It first did this in March 2009.
Quantitative easing (QE): the central bank creating new money electronically and using it to buy assets, mostly government bonds, to increase the money supply.
The Bank buys bonds from investors such as pension funds → bond prices rise and long-term interest rates fall → borrowing is cheaper for households and firms, and the sellers have money to lend or invest → spending and investment rise.
The Impact on the Economy as a Whole
Expansionary policy, fiscal or monetary, shifts AD to the right. What happens next depends on how much spare capacity the economy has.
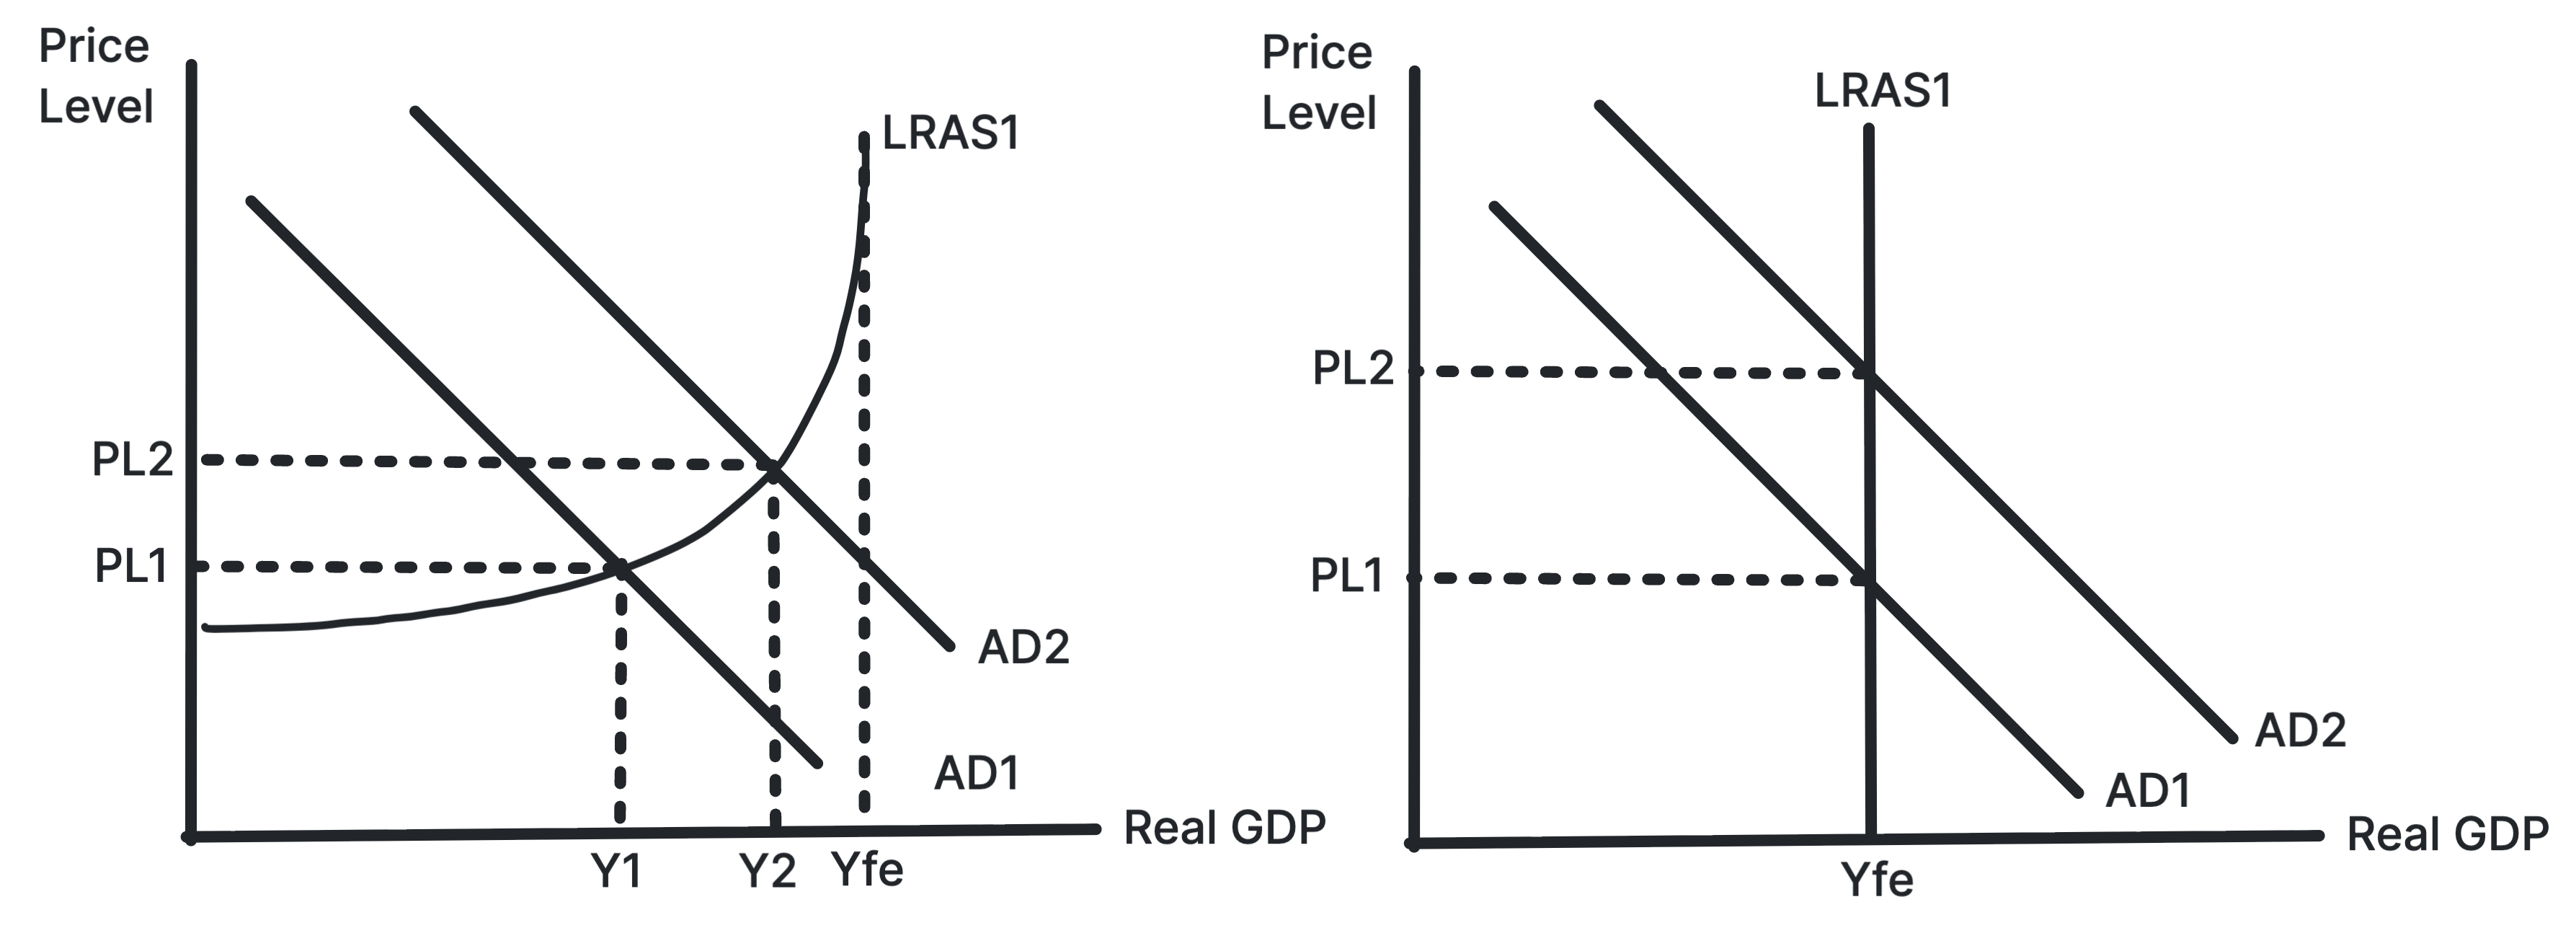
When AD rises:
- Growth: more spending → firms raise output → real GDP rises, by more than the first injection because of the multiplier (unit 4.4.1).
- Jobs: firms need more staff to meet demand → unemployment falls → household incomes rise.
- Prices: as spare capacity runs out, firms compete for workers and materials → costs rise → demand-pull inflation.
- Trade: higher incomes → more spending on imports → the current account deficit widens.
Contractionary policy shifts AD to the left, and each chain runs the other way: slower growth, lower inflation, fewer jobs and fewer imports.
Encouraging Investment, Jobs and Growth
In a downturn, policy-makers loosen policy to lift spending.
- Investment: lower Bank Rate or QE → cheaper loans → firms fund new machinery and premises. A cut in corporation tax, or tax relief on spending on equipment, leaves more profit to reinvest.
- Job creation: government spending on projects such as roads and housing → contracts for builders and suppliers → firms hire → their workers spend their wages, creating more jobs through the multiplier.
- Economic growth: income tax cuts leave households more to spend → higher sales → firms expand output. Spending on infrastructure can also raise capacity later, so it helps both AD and LRAS.
Controlling Inflation and Unemployment
To control inflation, the MPC raises Bank Rate → borrowing costs more and saving pays more → households and firms spend less → firms can raise prices less easily → inflation falls towards 2%. The government can help by raising taxes or cutting spending.
To reduce unemployment, policy-makers do the opposite and boost AD. This works for unemployment caused by weak demand. It does little for people whose skills don't match the jobs available or who live far from them. That needs supply-side policies (unit 4.4.3).
Demand-side policy can also stabilise the economy over the economic cycle: loosening in a recession and tightening in a boom.
Time Lags
Neither policy works straight away, and by the time it does, the economy may have changed.
- Monetary policy: the Bank of England estimates a change in Bank Rate takes around 18 to 24 months to have its full effect. Many households are on fixed-rate mortgages, so they only feel the change when their deal ends, and firms take months to plan an investment.
- Fiscal policy: the problem has to be spotted in data that arrive late, then a change announced in a Budget and passed into law. Building projects take years to plan.
A lag can make policy do harm. A rate cut meant for a recession that arrives as the economy is already recovering adds to inflation instead.
Strengths and Weaknesses
| Policy | Strengths | Weaknesses |
|---|---|---|
| Monetary policy | Set by an independent MPC, so free of short-term political pressure; Bank Rate can change at any meeting; it has a clear inflation target | Long time lags; one rate for the whole country, so it cannot target a region or industry; rate cuts have little room near zero, and QE can push up house and share prices, helping those who own them |
| Fiscal policy | Can be aimed at a region, industry or income group; government spending adds to AD directly, and works when interest rates are already low | Slow to plan and pass; extra borrowing adds to the national debt; tax rises and spending cuts are unpopular, so politics can delay them |
How well either policy works depends on:
- Confidence: in a deep recession, worried households save a tax cut and firms won't borrow however cheap loans are. Banks may also be unwilling to lend, as after the 2008 financial crisis. Either way, AD barely moves.
- The size of the multiplier: if much of the extra income is saved, taxed or spent on imports, the final rise in GDP is small.
- Spare capacity: near full capacity, higher AD mainly raises prices (Figure 1).
- Crowding out: heavy government borrowing can push up interest rates, so private investment falls and offsets some of the extra spending.
Policy Conflicts and Trade-Offs
A policy aimed at one objective often makes another worse, so policy-makers have to choose which matters most at the time.
- Growth or low inflation: boosting AD → more output and jobs → but near capacity, rising prices. Raising rates to cut inflation slows growth and can cost jobs.
- Growth or the current account: higher incomes → more imports → a wider trade deficit.
- Now or later: tax cuts and spending funded by borrowing → more growth now → but higher debt interest, and higher taxes or lower spending in future.
- Growth or equality: low interest rates and QE → higher house and share prices → gains for people who own them, while first-time buyers are priced out.
- Growth or the environment: more output → more energy use and pollution.
The two policies can also pull against each other. If the government loosens fiscal policy while inflation is above target, the MPC may raise Bank Rate to offset it.
The government does not set interest rates. Bank Rate is monetary policy, set by the Bank of England's MPC. Fiscal policy is spending and taxes, set by the Chancellor in a Budget. Name the right body, and say which policy you are analysing before you shift AD.
Stuck on this topic? Work through it with an online A-Level Economics tutor in a free 15-minute intro call, or send an essay on it for A-Level Economics essay marking.