Marginal, Average and Total Revenue
Key Definitions
Total Revenue (TR): \( P \times Q \)
Average Revenue (AR): \( \frac{TR}{Q} \). This is the price per unit and also the firm's demand curve.
Marginal Revenue (MR): \( \frac{\Delta TR}{\Delta Q} \). This is the additional revenue from selling one more unit.
Revenue in Perfect Competition
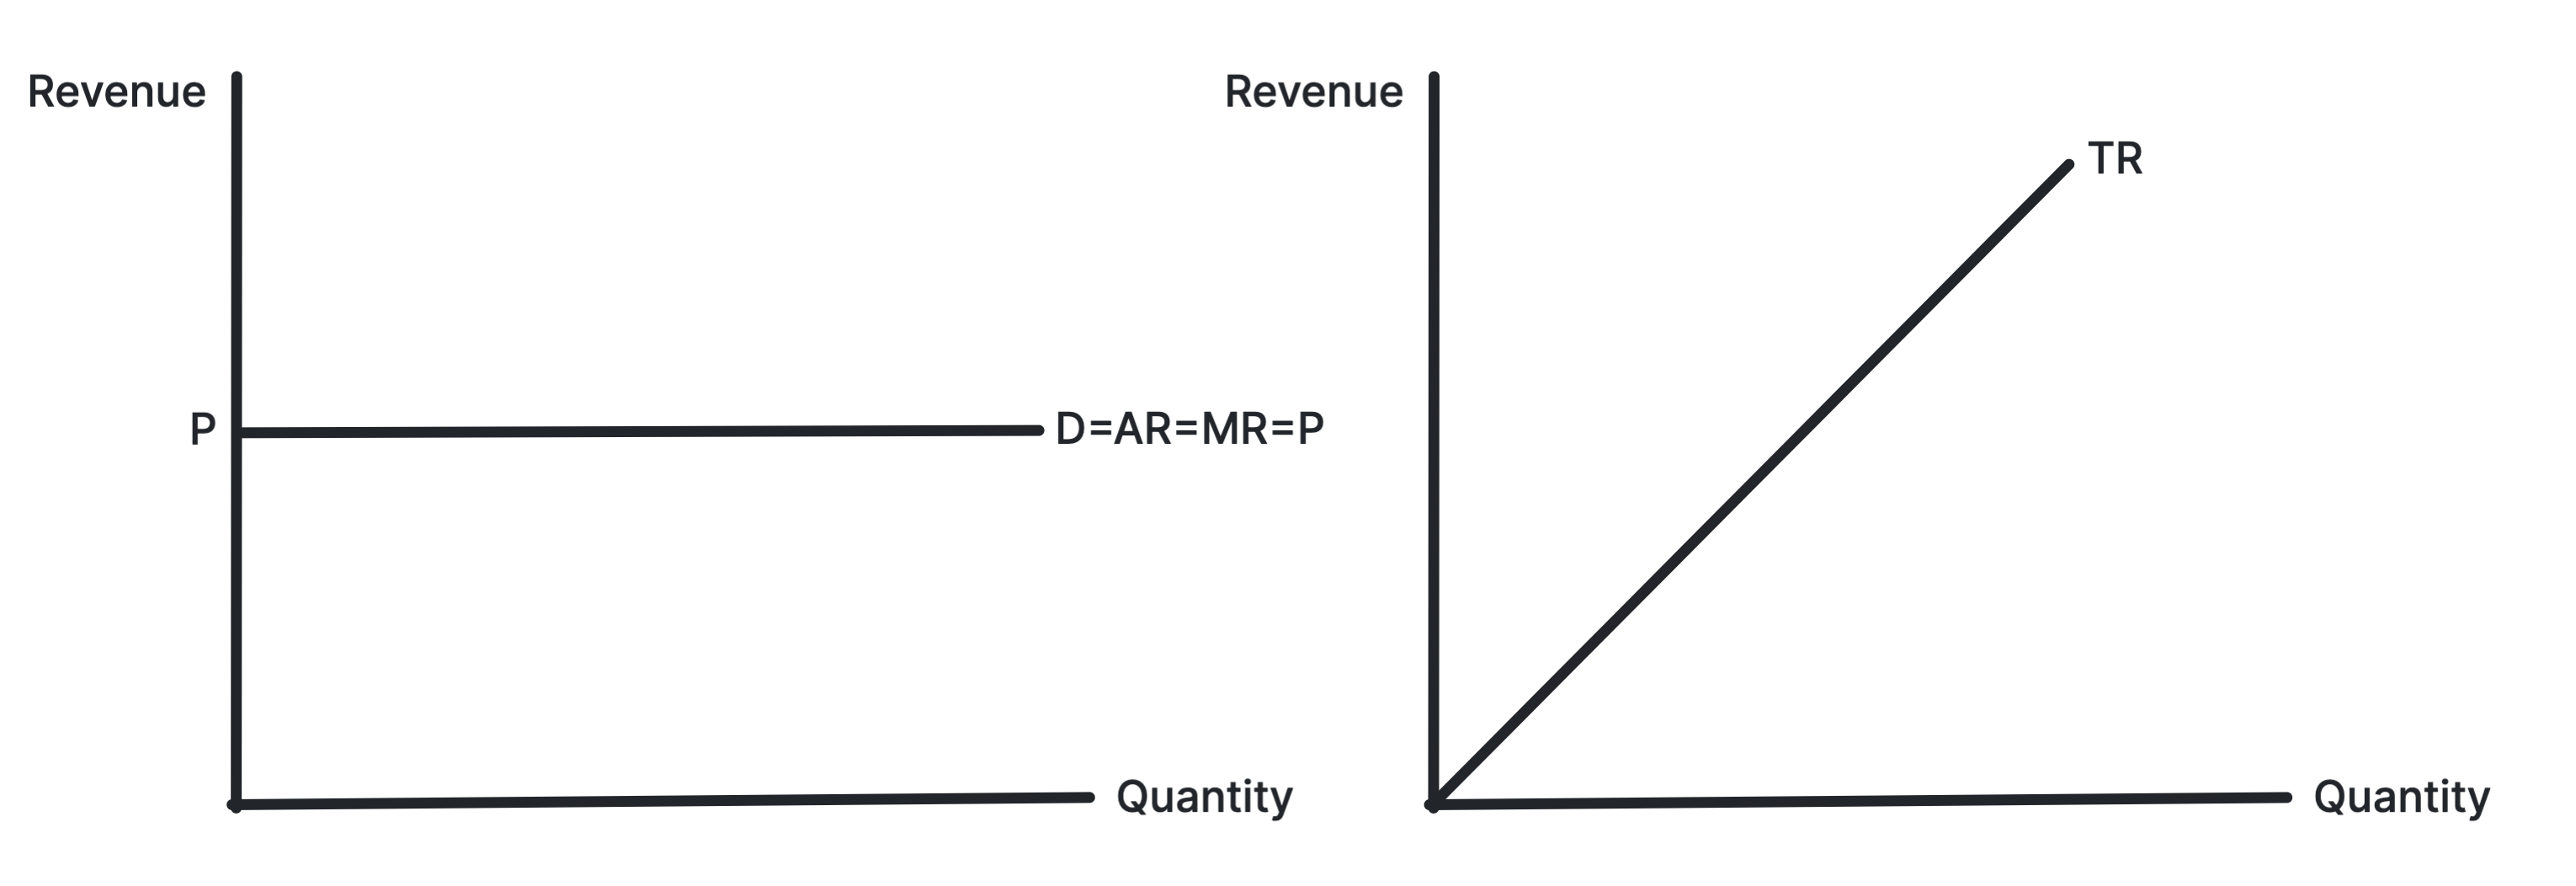
Firms in perfect competition are price takers, so they sell at the market price.
This means \( AR = MR = Price \), and the demand curve facing the firm is perfectly elastic, so it is horizontal.
Revenue in Imperfect Competition
Firms in imperfect competition have market power and are therefore price makers, so to sell more output they must lower the price.
As a result, AR, which is the demand curve, is downward sloping, and MR is also downward sloping but lies below AR.
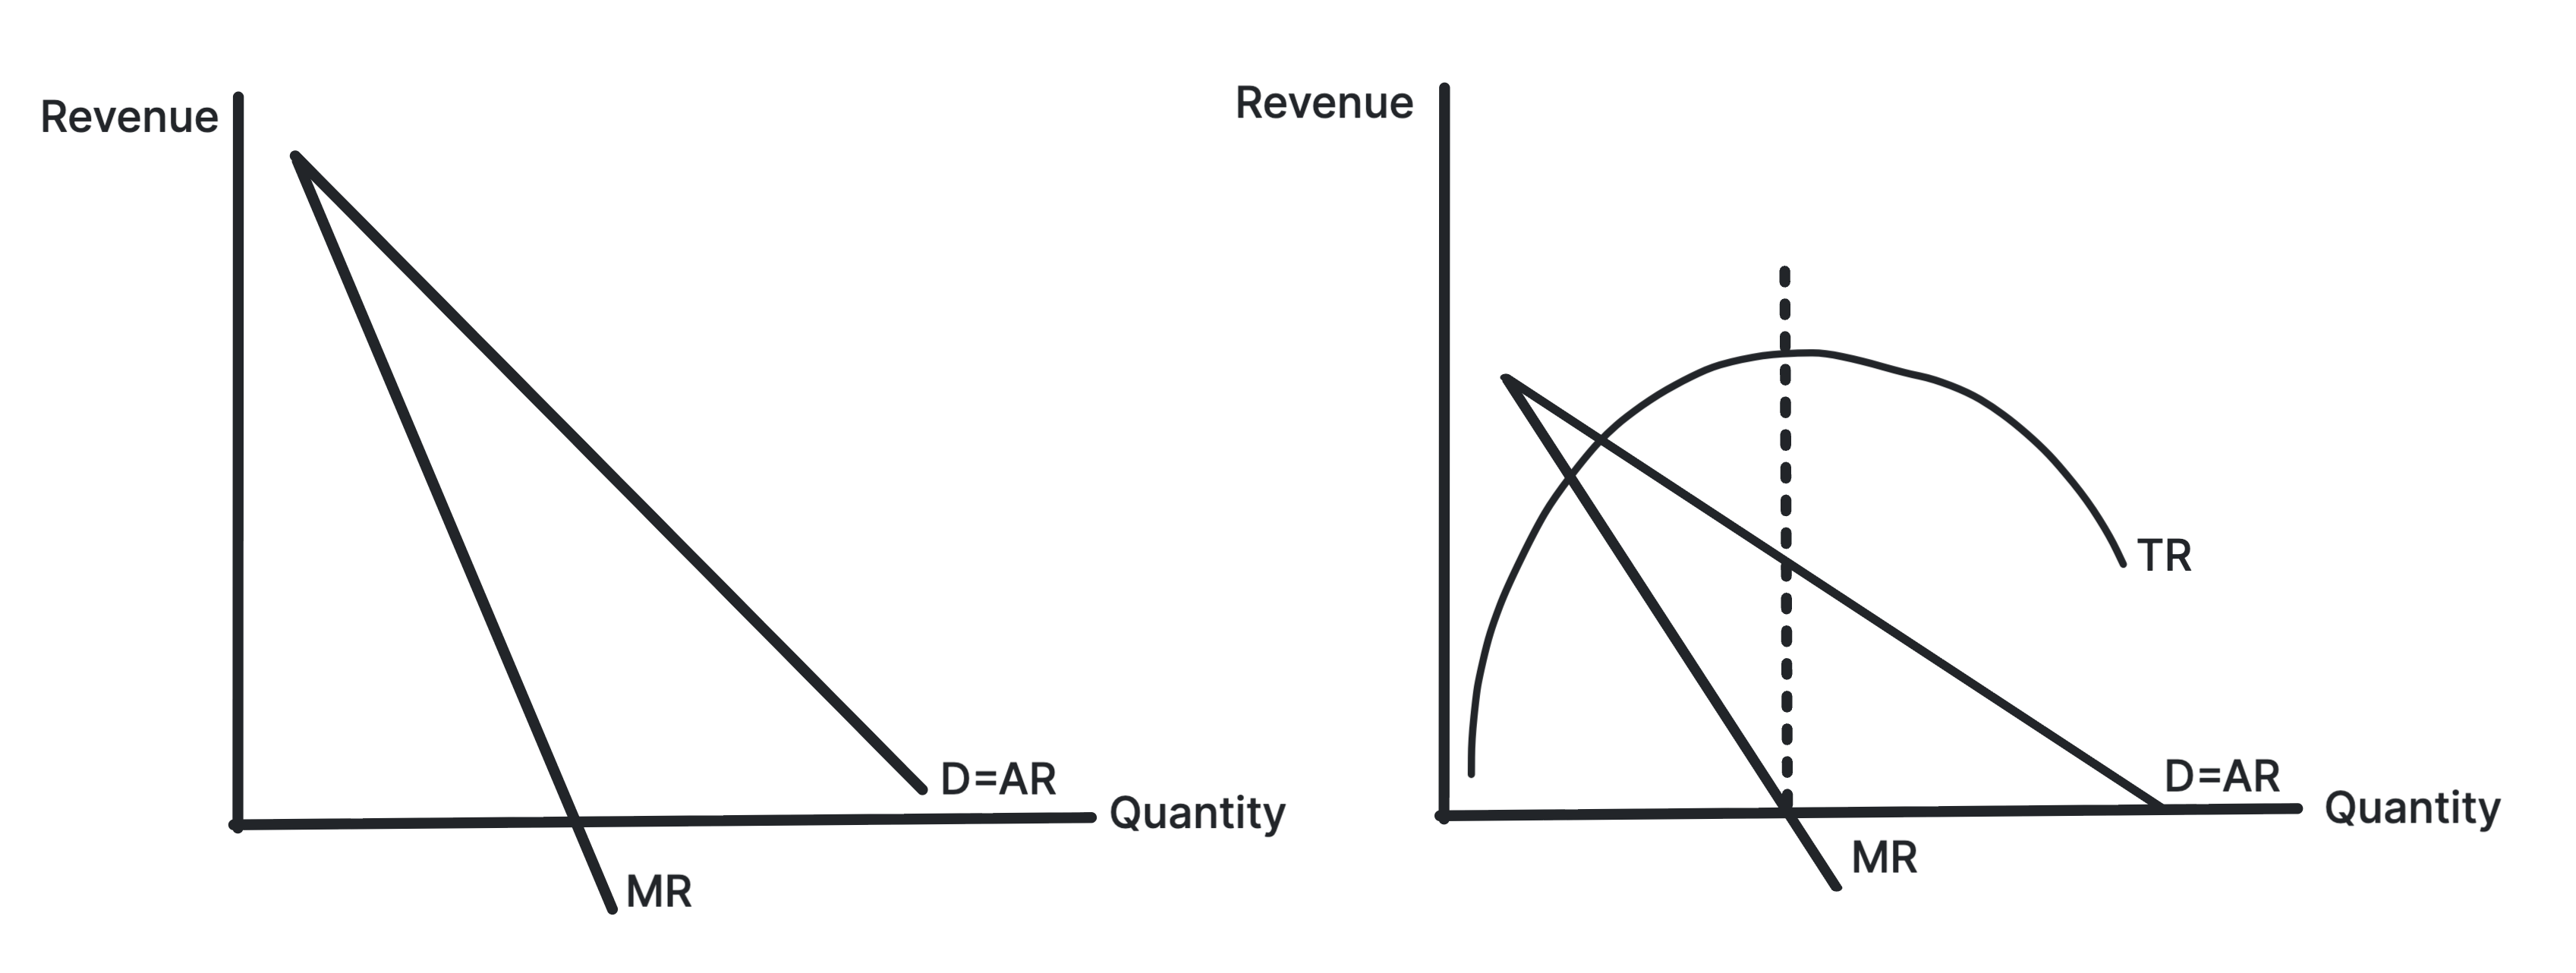
A key point is that in a linear diagram the MR curve is twice as steep as the AR curve. The right hand diagram shows that total revenue is maximised when \( MR = 0 \).
Worked Example: Total, Average and Marginal Revenue
A firm with market power must lower its price to sell more. This schedule is read off its demand curve:
| Price (AR) | Quantity | TR = P × Q | MR |
|---|---|---|---|
| £10 | 1 | £10 | — |
| £8 | 2 | £16 | £6 |
| £6 | 3 | £18 | £2 |
| £4 | 4 | £16 | −£2 |
Price and AR are the same figure in every row. MR falls twice as fast and stays below AR, because to sell one more unit the firm must cut the price on every unit, not just the last one. Total revenue peaks at £18, at the output where MR turns from positive to negative.
Stuck on this topic? Work through it with an online A-Level Economics tutor in a free 15-minute intro call, or send an essay on it for A-Level Economics essay marking.