Poverty and Inequality
Absolute and Relative Poverty
Absolute poverty: when a household cannot afford the basics needed to survive, such as enough food, clean water, shelter and basic healthcare.
Relative poverty: when a household's income is well below the typical income in its own country, so it cannot afford the standard of living most people there take for granted.
A UK family that can pay for food and rent but not for school trips, a working fridge or heating all winter is in relative poverty. A family in a low-income country that can't afford two meals a day is in absolute poverty.
The two can move in different directions. Economic growth usually cuts absolute poverty, as more people can afford the basics. Relative poverty only falls if the poorest households' incomes rise faster than the typical household's.
Poverty and inequality are also different. Poverty is about the people at the bottom. Inequality is about the gap between the top and the bottom, and a country can be unequal with very little absolute poverty.
Measures of Poverty
Each country sets its own national measures. The UK's is relative: a household is in relative low income if its income is below 60% of the median household income that year, after adjusting for the size of the household. The median is the middle income (unit 2.4.2).
International measures use one line for every country, so poverty can be compared across the world:
| Measure | What it counts | Limitation |
|---|---|---|
| World Bank poverty line | People living on less than $3.00 a day, adjusted for what money buys in each country; this is extreme poverty | Someone on $3.10 a day counts as not poor, though their life is much the same |
| Multidimensional Poverty Index (MPI) | People who lack several basics at once in health, education and living standards, such as schooling, clean water or electricity | Needs detailed household surveys, which some countries carry out only every few years |
Growth has almost ended extreme poverty in China (unit 3.1.1), but it is still common in parts of sub-Saharan Africa.
The Lorenz Curve
Lorenz curve: a curve showing the cumulative share of total income held by the cumulative share of households, ranked from poorest to richest.
If every household had the same income, the poorest 20% would have 20% of the income, the poorest 50% would have 50%, and so on. That gives the straight 45-degree line of perfect equality in Figure 1.
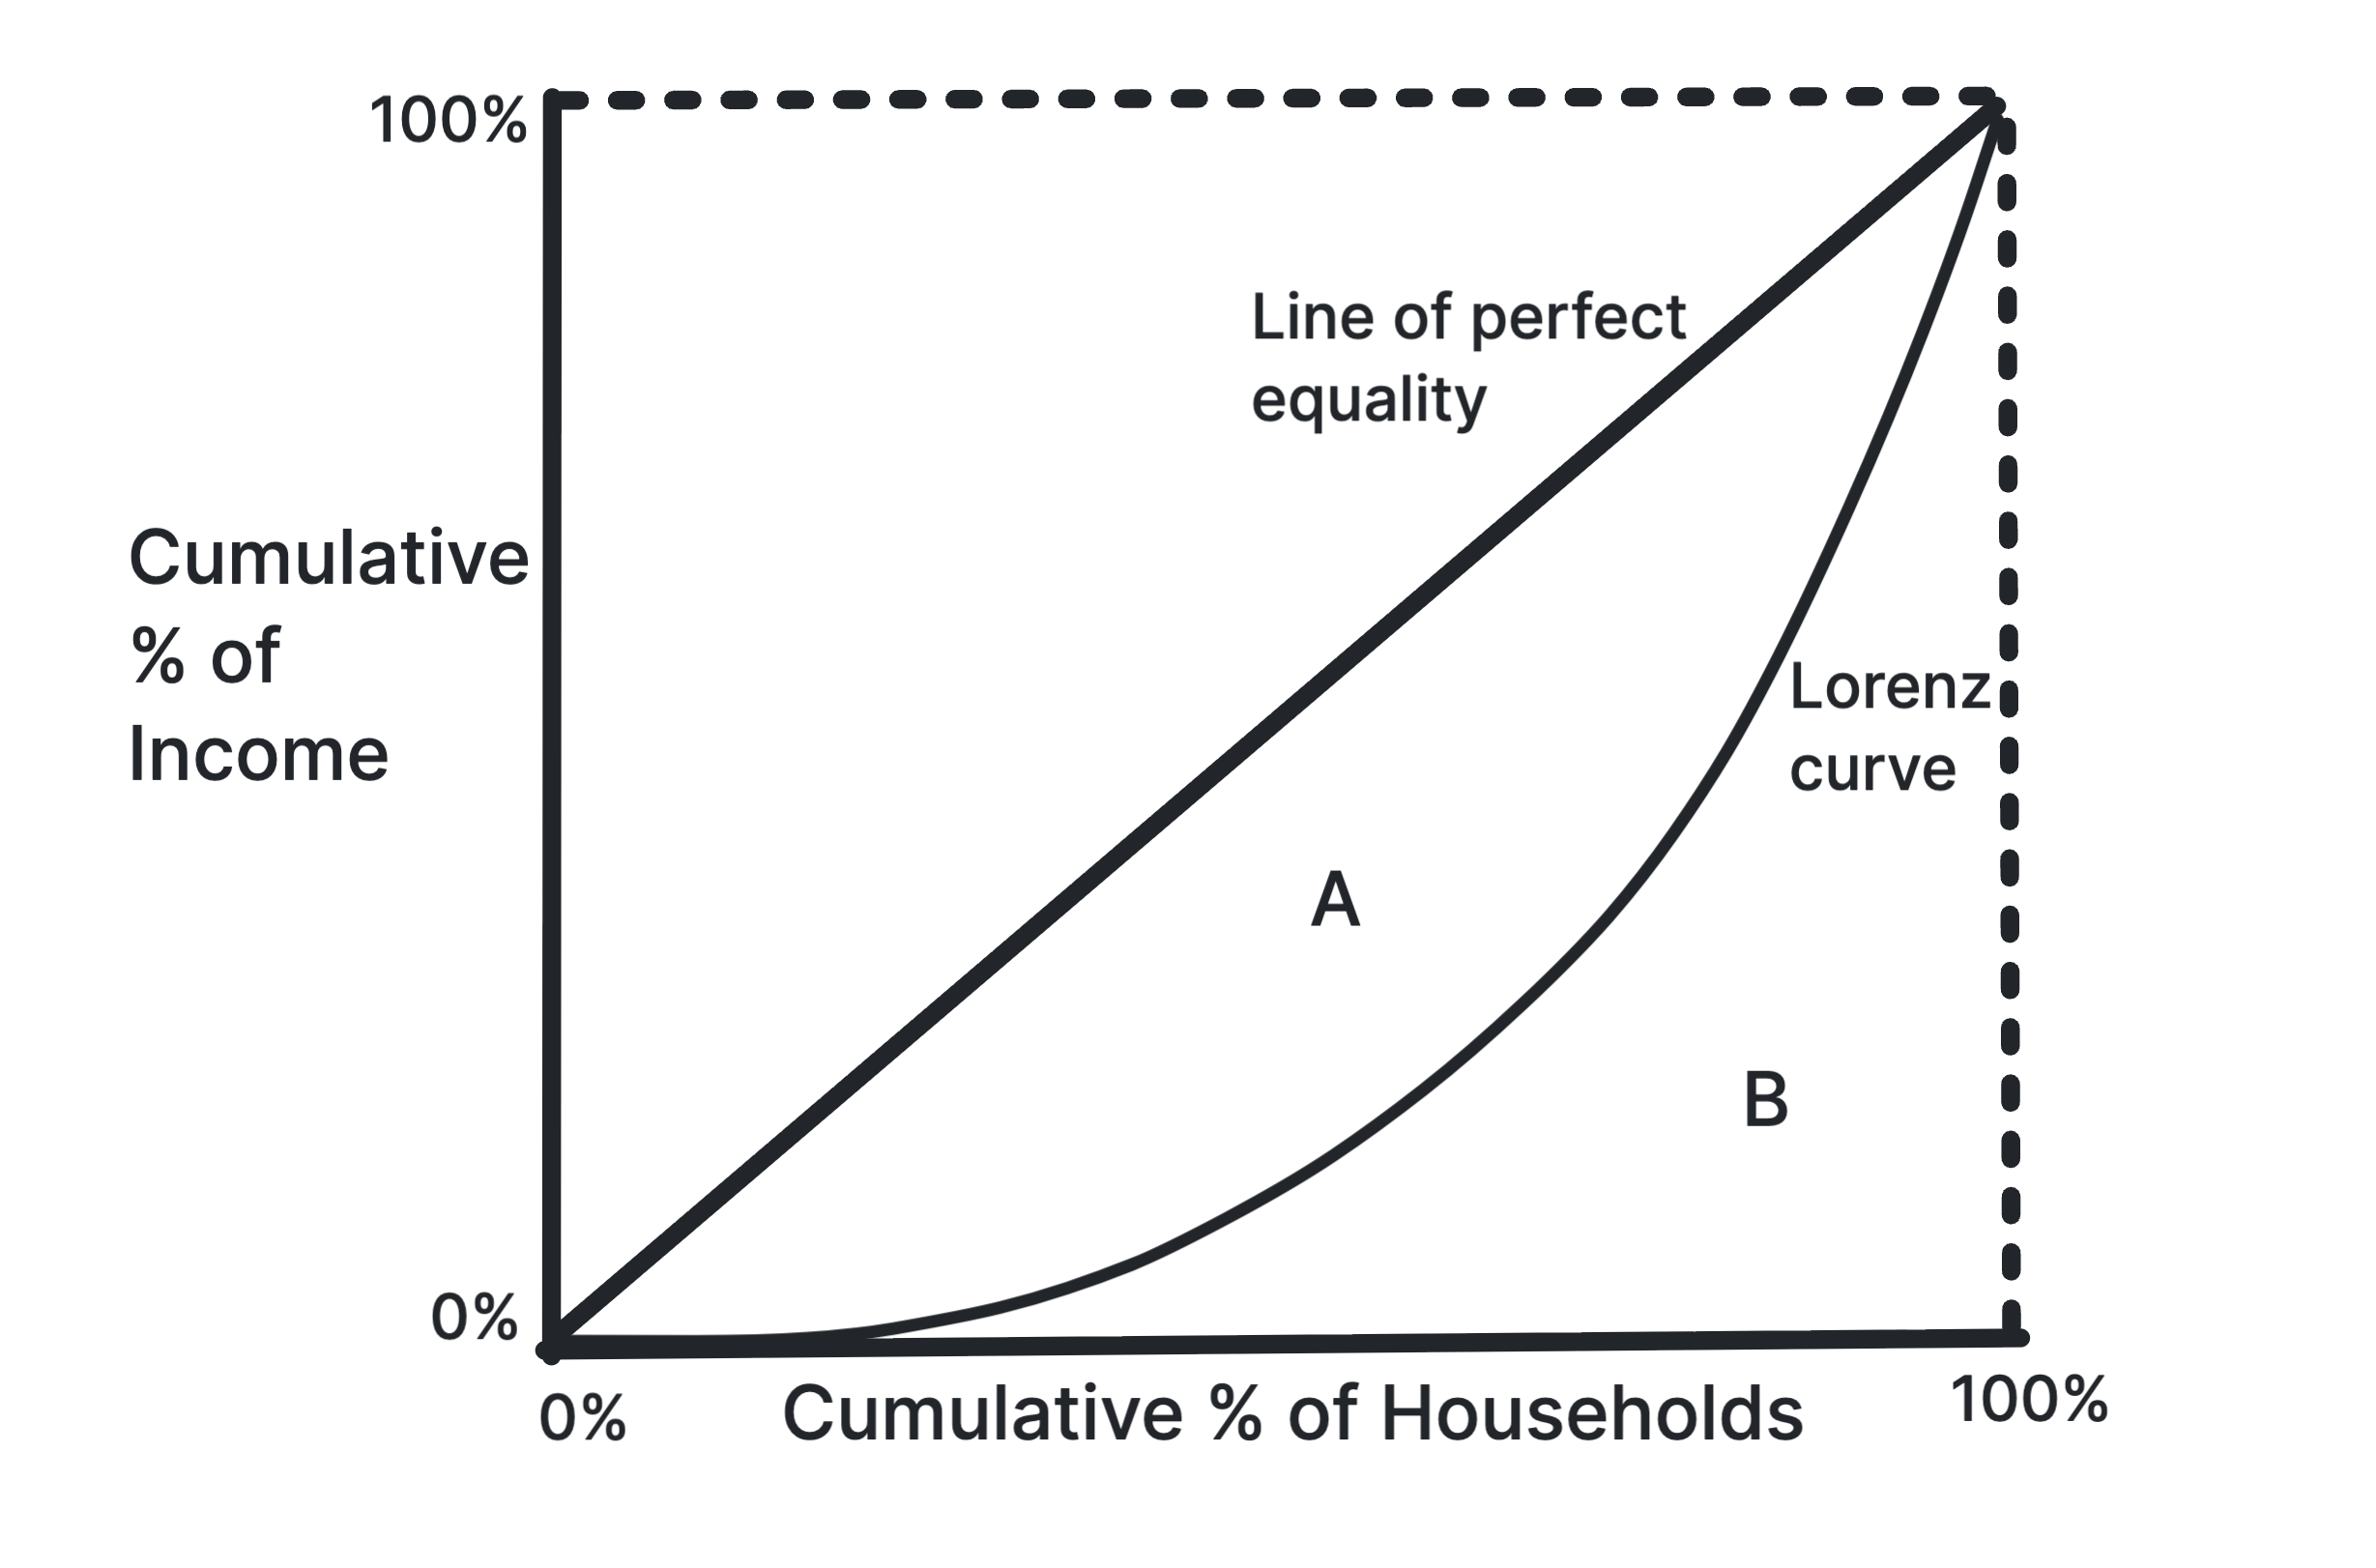
In practice, poorer households get less than their share, so the curve sags below the line. To read it, pick a point on the horizontal axis. If the curve passes through 50% of households and 25% of income, the poorest half of households receive only a quarter of all income.
The further the curve bows away from the line, the greater the inequality. Redistribution, such as higher taxes on high incomes paid out as benefits to low ones (unit 3.6.4), moves the curve towards the line. Two curves on one diagram compare two countries, or one country at two dates.
The Gini Coefficient
Gini coefficient: a measure of inequality calculated from the Lorenz curve, as area A divided by the whole area under the line of perfect equality: \[ \text{Gini coefficient} = \frac{A}{A + B} \]
It runs from 0 to 1, and is sometimes shown as a percentage from 0 to 100:
- 0 is perfect equality: the Lorenz curve sits on the line, so area A is zero.
- 1 is perfect inequality: one household has all the income, so area B is zero.
A higher figure means more inequality. The UK's Gini coefficient for household disposable income, after taxes and benefits, is about 0.33 (ONS).
The Gini coefficient is useful, but:
- It hides where the inequality is: two Lorenz curves of different shapes can enclose the same area A, so a gap at the bottom and a gap at the top can give the same figure. The Lorenz curve shows which.
- It depends on what is measured: income before taxes and benefits is more unequal than income after them, and wealth is far more unequal than income.
Relative poverty can rise while everyone gets better off. If the median income grows faster than the incomes of the poorest, more households fall below 60% of it, even though they can afford more than before. Say which measure of poverty a figure uses before you judge whether poverty is rising or falling.
Stuck on this topic? Work through it with an online A-Level Economics tutor in a free 15-minute intro call, or send an essay on it for A-Level Economics essay marking.