Market Failure and Externalities
Private, External and Social Costs
Private costs: the costs paid by the firm or person carrying out an activity, such as a firm's wages, materials and energy, or the price a consumer pays for a good.
External costs: costs that fall on a third party, someone outside the transaction, who is not compensated for them. Noise, pollution and congestion are the usual examples.
Social costs: the full cost of an activity to society, which is the private cost plus any external cost.
Social cost = private cost + external cost
Take a quarry that spends £40 to dig each tonne of stone, while its dust and lorries cause £15 of damage per tonne to people nearby. The social cost is £55 a tonne. The quarry prices from its own £40 → stone sells for less than its cost to society → more is bought → the neighbours bear the £15.
Private, External and Social Benefits
The same split works for benefits.
Private benefits: the benefits that go to the person or firm who buys, uses or makes something, such as the enjoyment a consumer gets from a good or the revenue a firm earns from selling it.
External benefits: gains that go to third parties, who do not pay for them.
Social benefits: the full benefit of an activity to society, which is the private benefit plus any external benefit.
Social benefit = private benefit + external benefit
Externality: an external cost or external benefit. A negative externality is an external cost and a positive externality is an external benefit.
Costs and Benefits from Production and Consumption
Externalities can come from making a good or from using it, so there are four cases to know.
| Type | Who causes it | Examples |
|---|---|---|
| External cost of production | A firm, while making a good | Water companies releasing sewage into rivers and the sea; a factory's fumes harming the health of people nearby |
| External cost of consumption | A consumer, while using a good | Drivers adding to congestion and air pollution for everyone else on the road; loud music keeping the neighbours awake |
| External benefit of production | A firm, while making a good | A firm trains its staff, some of whom later take those skills to other employers; a beekeeper's bees pollinate the crops on nearby farms |
| External benefit of consumption | A consumer, while using a good | A vaccinated person is less likely to pass a disease on; an educated worker makes the people around them more productive |
The people causing an externality do not have to think about it: the quarry does not pay for the dust, and someone having a flu jab is not paid for protecting others. Decisions are made on private costs and benefits alone.
When Markets Fail
Market failure: when the free market leads to too much or too little of a good being produced or consumed, so resources are not allocated in the best way for society.
Diagrams for this use the letters MPC, MSC, MPB and MSB. The M stands for marginal, the cost or benefit of one more unit. The supply curve is the marginal private cost (MPC) and the demand curve is the marginal private benefit (MPB).
Social optimum: the output where the social cost of one more unit equals its social benefit, written MSC = MSB on a diagram. The last unit made costs society exactly what it is worth to society.
In most markets there is no externality, so private and social costs and benefits are the same. The market equilibrium is then the social optimum, and the market works well on its own. When there is an externality, the two points split apart, and the market ends up at Q1 when society would be better off at Q2.
Overproduction
An external cost of production puts the marginal social cost (MSC) above the supply curve. The gap between the two is the external cost of each unit. The market settles where supply meets demand, at Q1, but the social optimum is where MSC meets demand, at Q2.
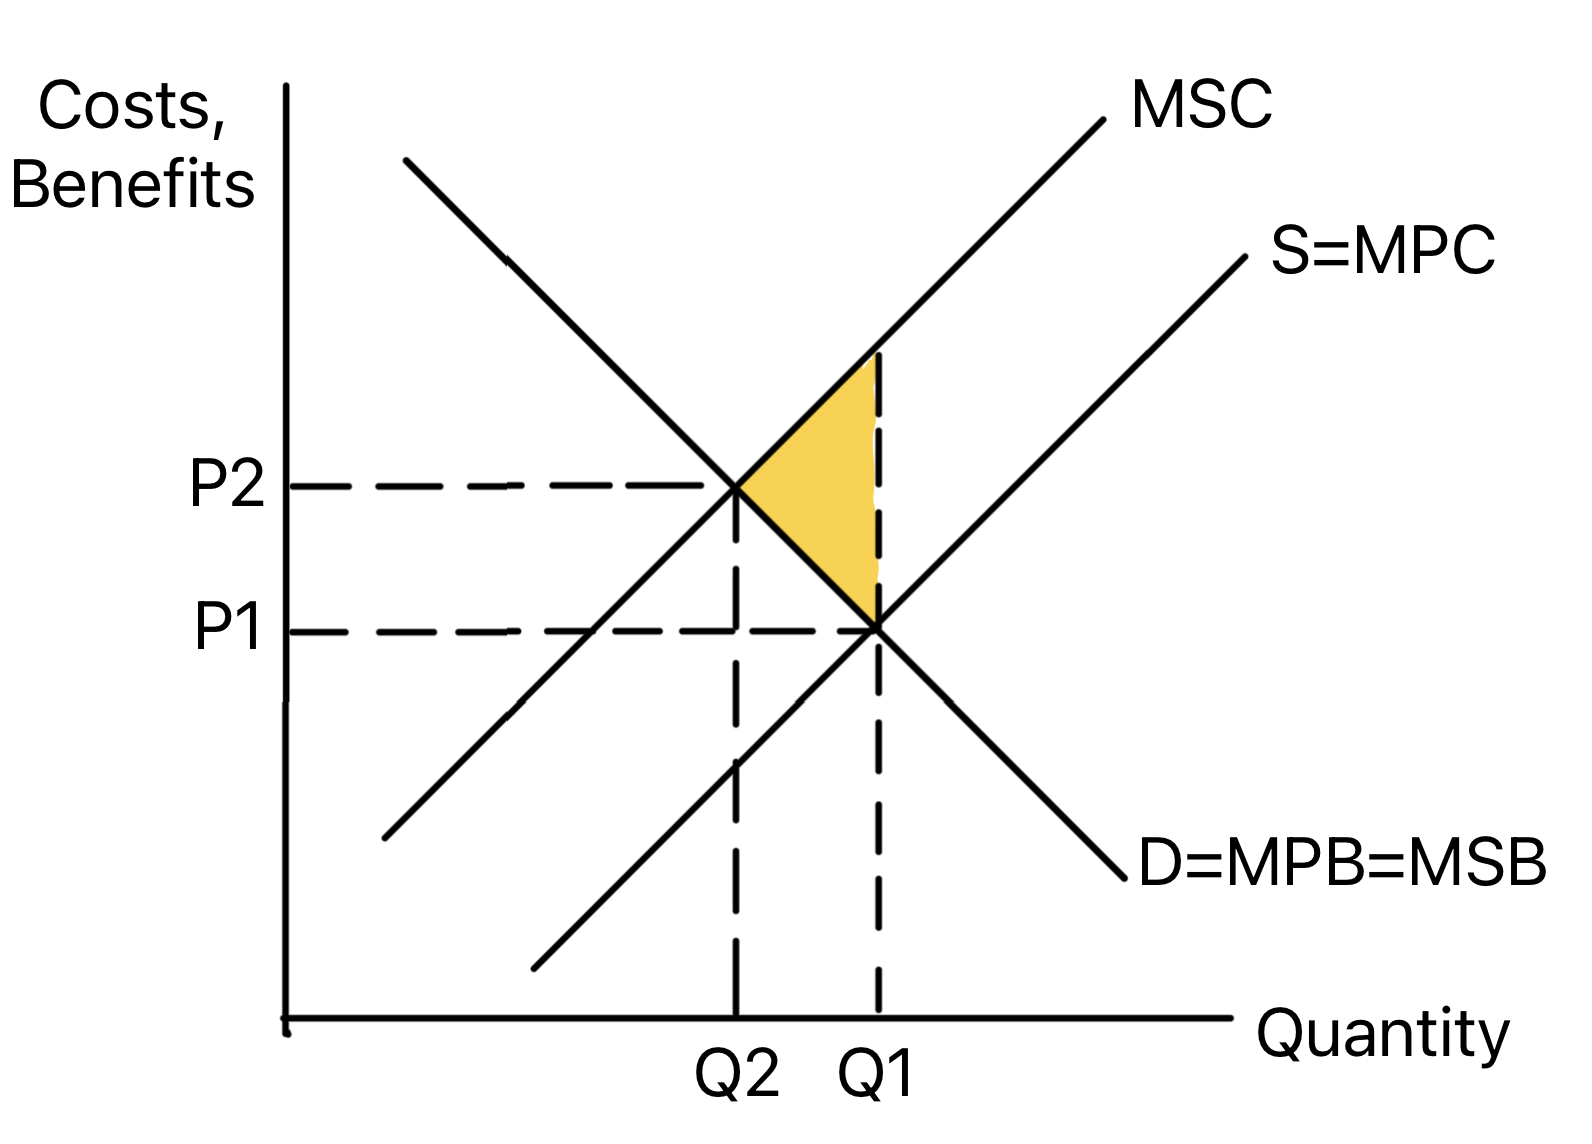
Between Q2 and Q1, each extra unit costs society more than it is worth to buyers, and the price P1 is too low because it leaves out the external cost. The shaded triangle is the welfare loss: the cost to society of those extra units, over and above what they are worth.
Overconsumption
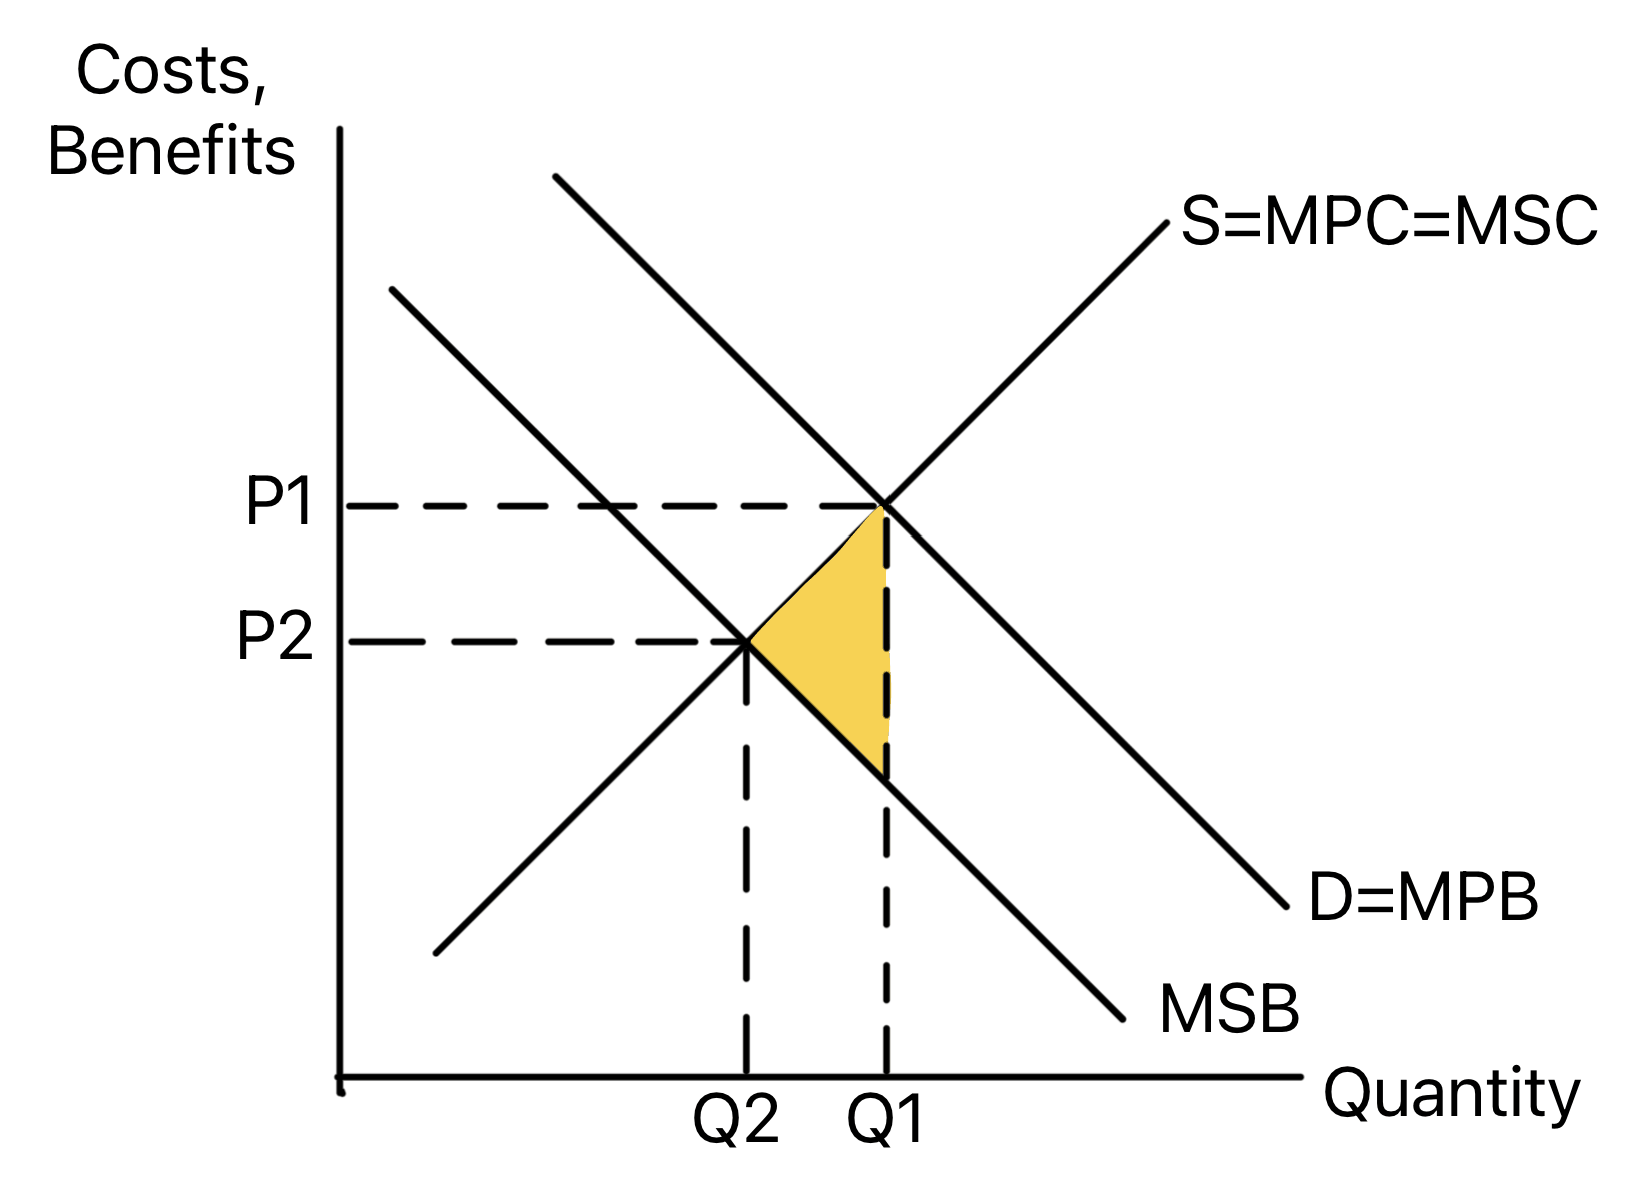
An external cost of consumption puts the marginal social benefit (MSB) below the demand curve, because using the good harms other people. Each driver weighs up their own fuel and time, not the delay and pollution they add for everyone else. Consumers buy Q1, more than the social optimum Q2.
Underproduction
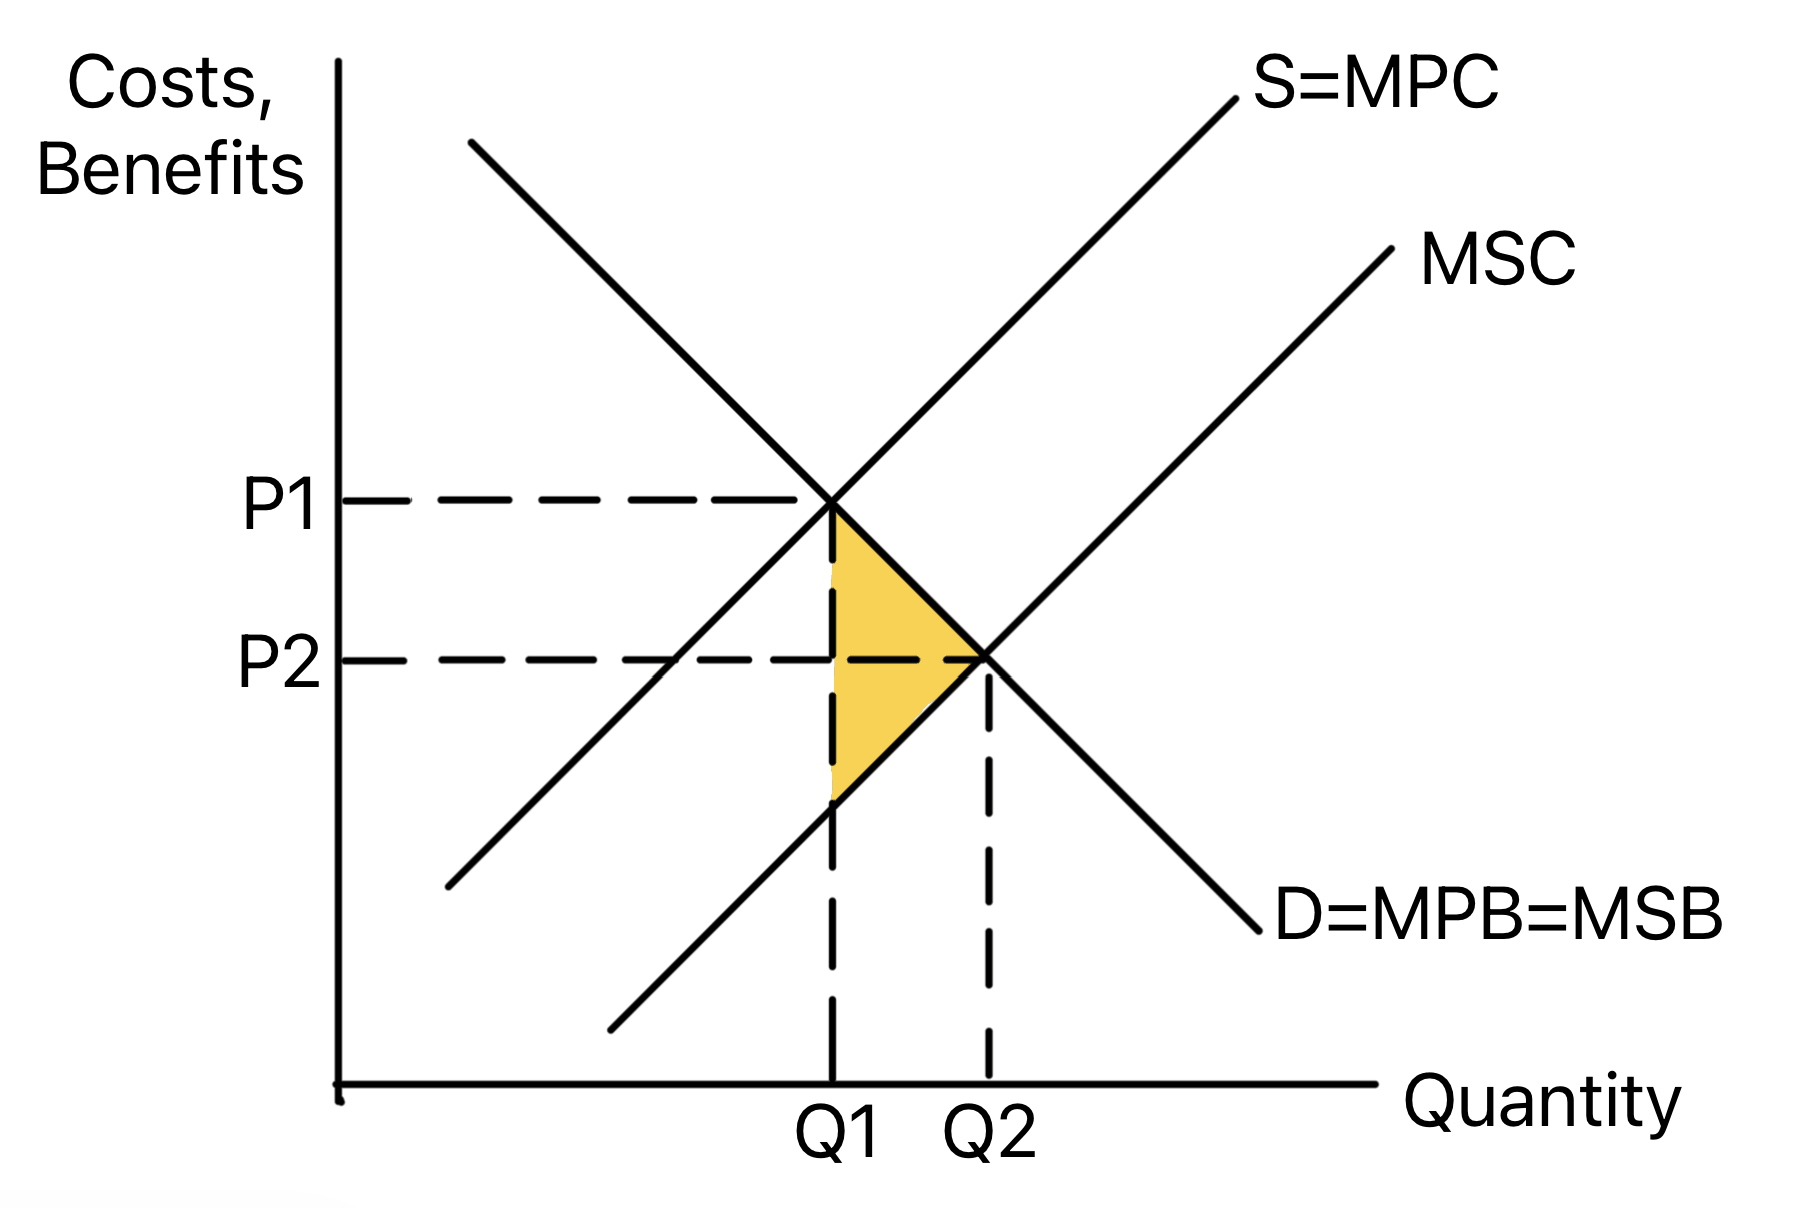
An external benefit of production puts the marginal social cost (MSC) below the supply curve, because making the good helps other people. A firm that trains its staff counts the cost of the training but not the gain to the employers they move on to. The market produces Q1, less than the social optimum Q2.
Underconsumption
An external benefit of consumption puts the marginal social benefit (MSB) above the demand curve. Someone deciding whether to have a vaccine thinks about their own health, not the people they would no longer infect. Consumers buy Q1, less than the social optimum Q2.
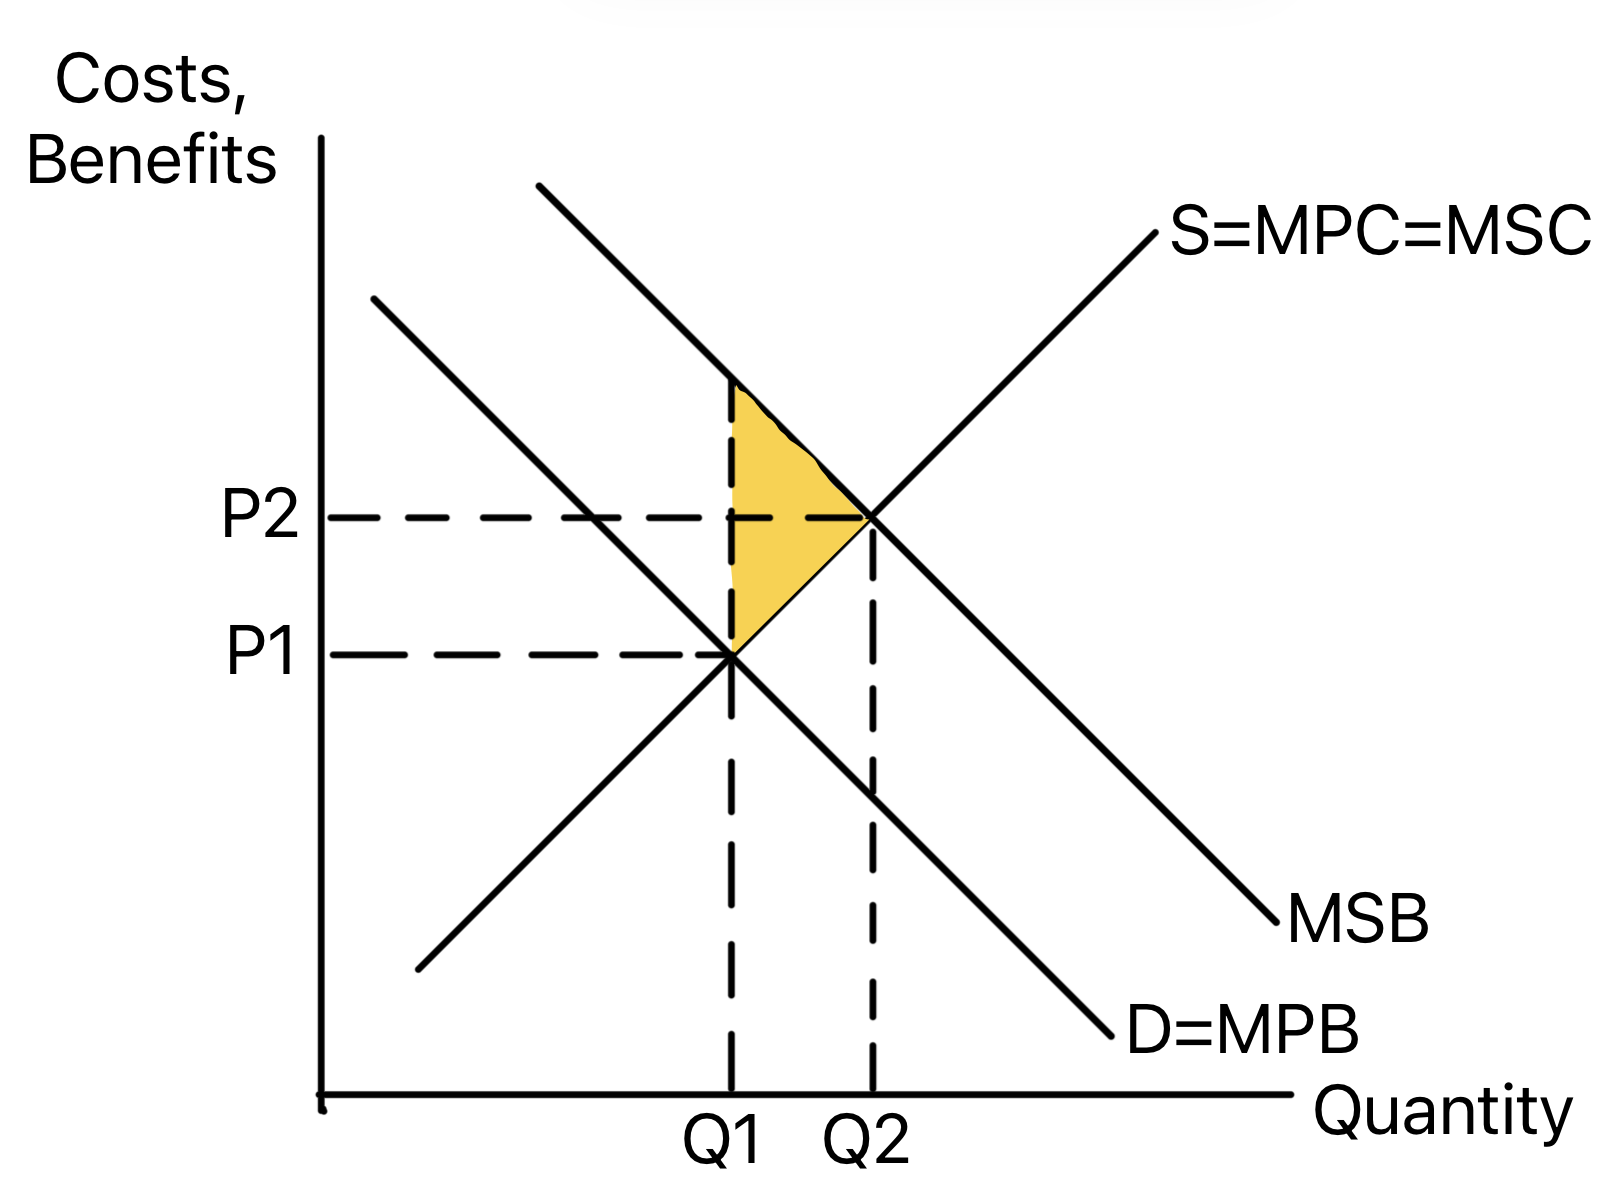
With under-provision, the shaded triangle is the benefit society misses out on: units between Q1 and Q2 that would have been worth more to society than they cost to make.
The market stays at Q1. An externality does not shift supply or demand. MSC and MSB are extra lines that show what the market leaves out, so the market outcome is still where S=MPC meets D=MPB. Say which way Q1 is from Q2, shade the triangle between them and name it as the welfare loss. Moving the market towards Q2 takes government intervention, covered in 1.5.2.
Stuck on this topic? Work through it with an online A-Level Economics tutor in a free 15-minute intro call, or send an essay on it for A-Level Economics essay marking.