The Distribution of Income and Wealth
Key Definitions
Income inequality is the unequal distribution of earnings, such as wages, rent, interest, and profit. Income is a flow of money over a period of time.
Wealth inequality is the unequal distribution of assets, such as property, shares, and savings. Wealth is a stock of monetary value at a point in time.
Measuring Inequality: Lorenz Curve and Gini Coefficient
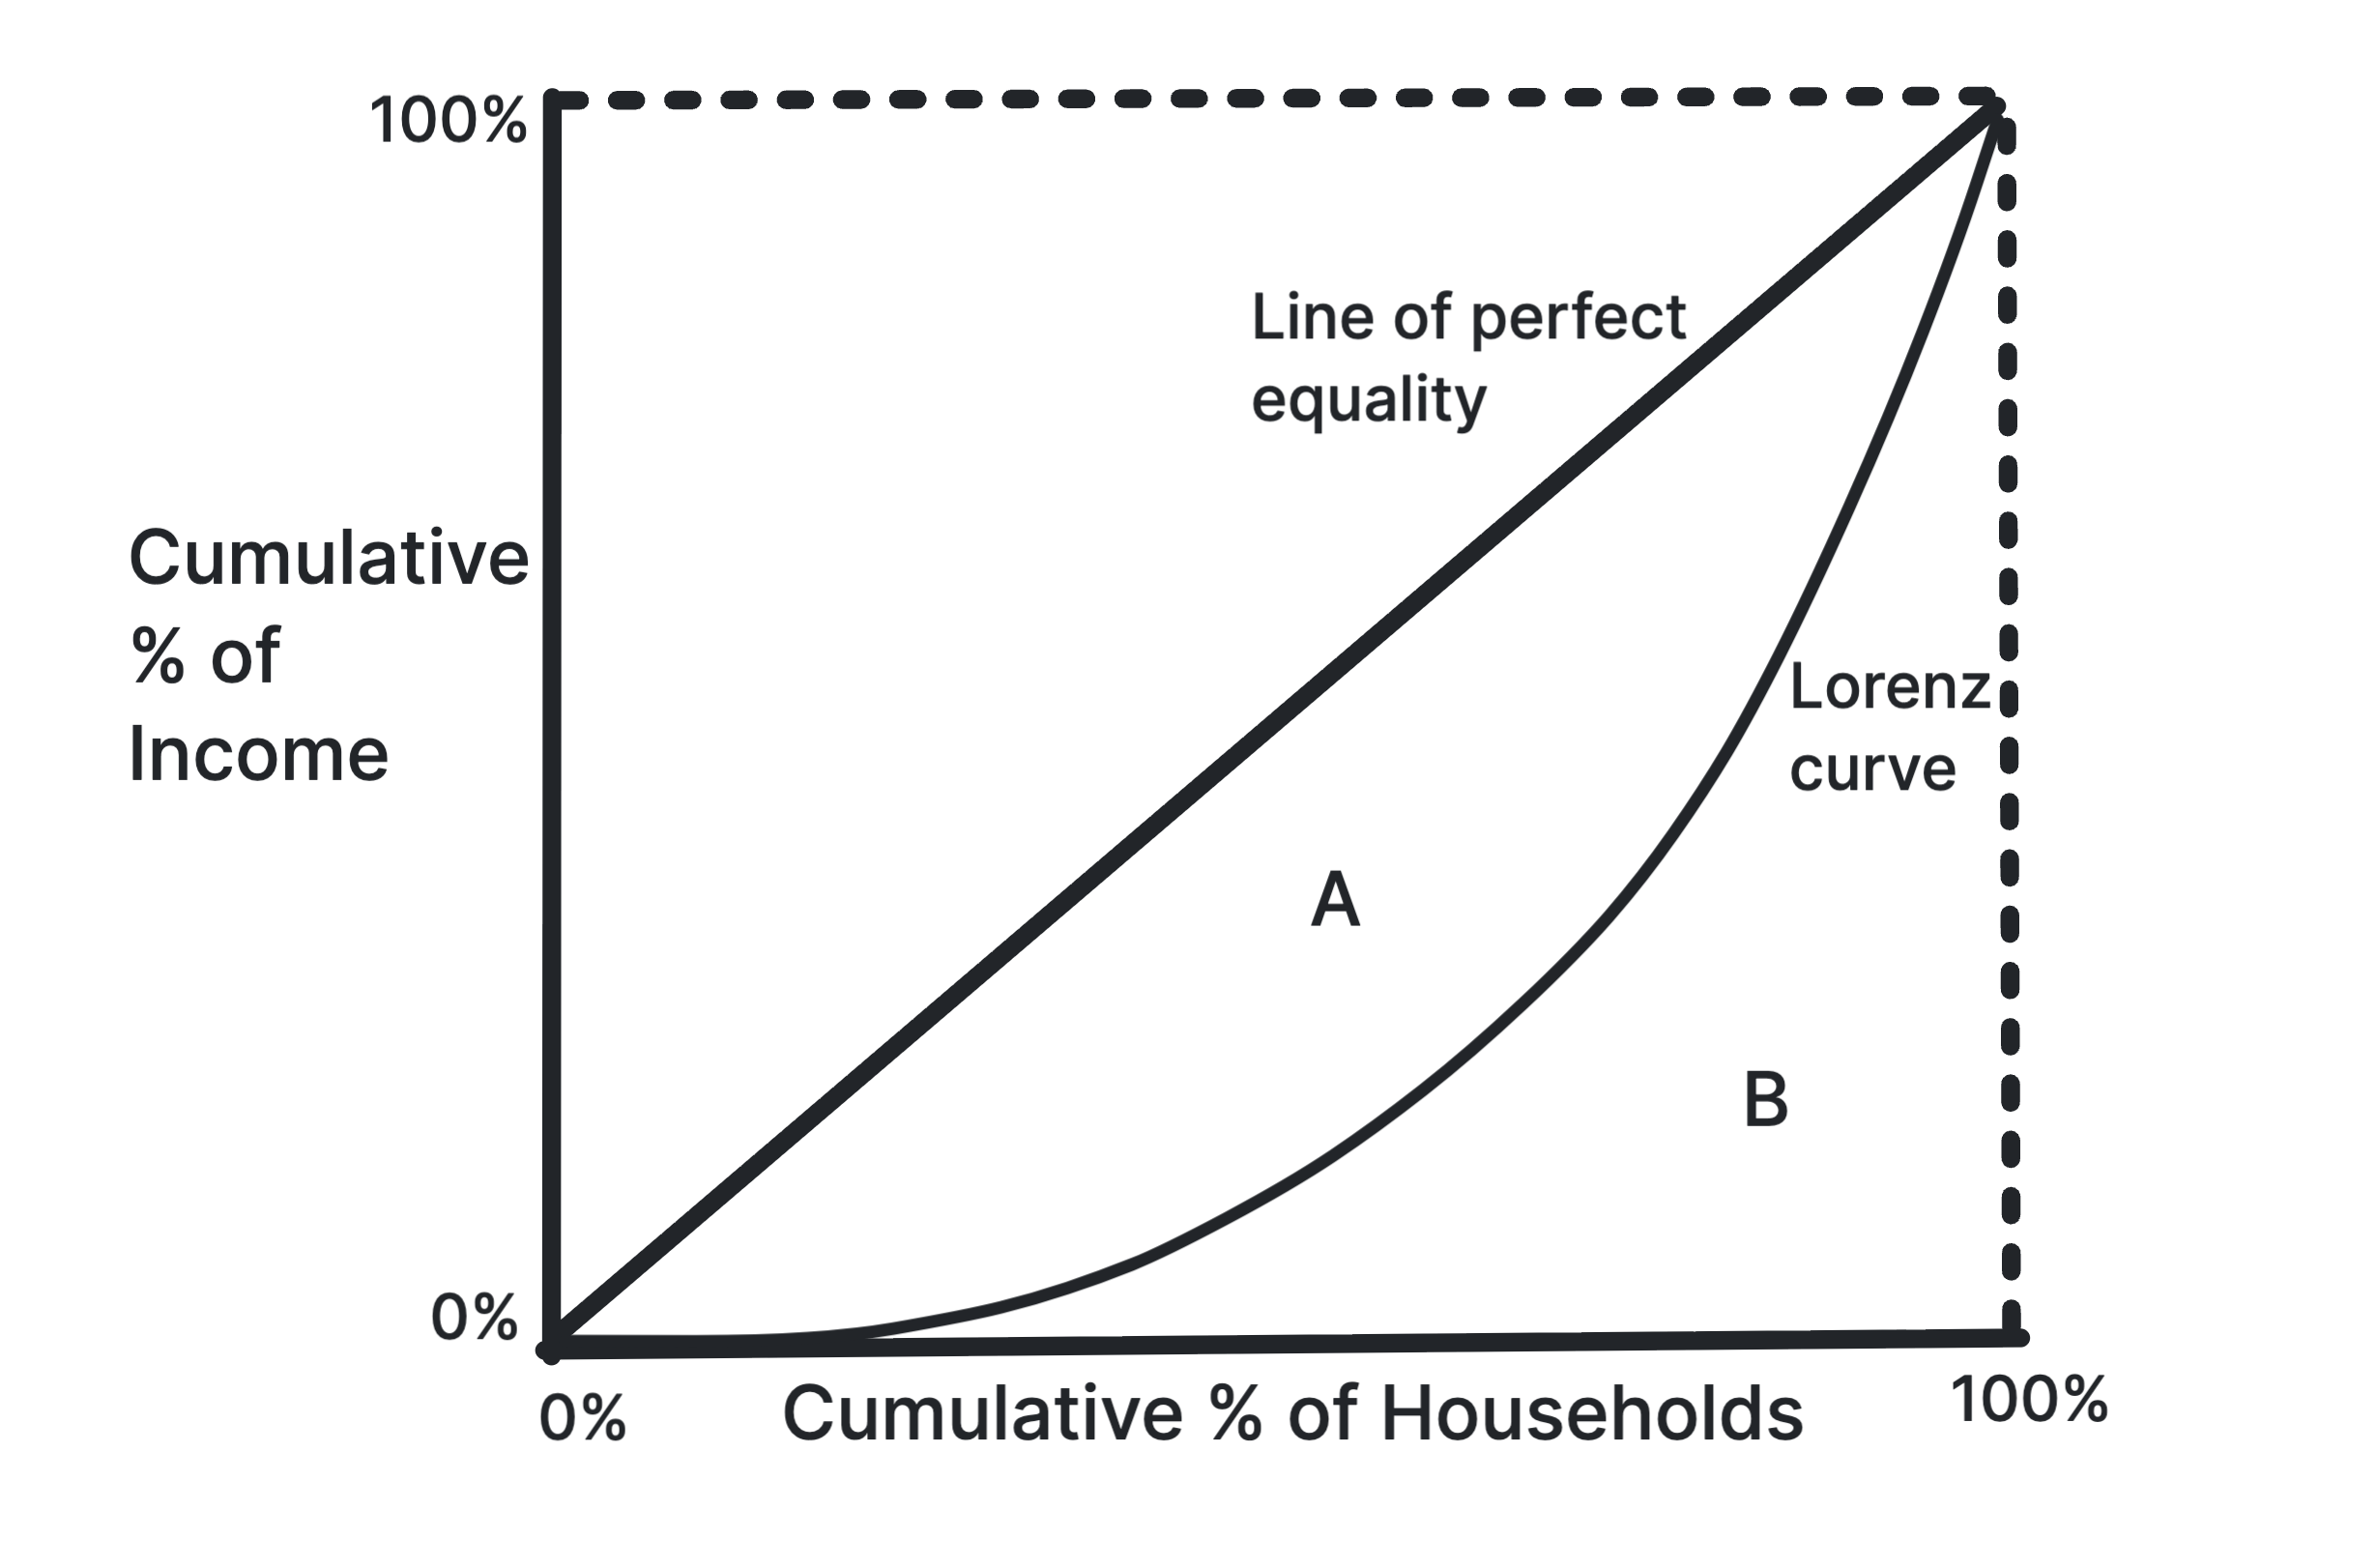
The Lorenz curve is a graphical representation of income or wealth distribution. It plots the cumulative percentage of total income or wealth against the cumulative percentage of the population.
The line of perfect equality represents a situation where everyone has the same income or wealth, while the Lorenz curve shows the actual distribution. The further the Lorenz curve is from the line of perfect equality, the greater the inequality.
The Gini coefficient is a numerical measure of inequality derived from the Lorenz curve. It is calculated as the ratio of the area between the line of perfect equality and the Lorenz curve (A) to the total area under the line of perfect equality (A + B).
\[ \text{Gini Coefficient} = \frac{A}{A + B} \]
- 0 means perfect equality.
- 1 means perfect inequality.
- A higher Gini coefficient indicates greater inequality.
Causes of Income and Wealth Inequality
| Factor | Effect on Inequality |
|---|---|
| Education and skills | Differences in access to quality education and skill development can lead to wage disparities, as higher-skilled workers command higher salaries. |
| Tax system | Progressive tax systems can reduce income inequality by taxing higher incomes at higher rates and redistributing the revenue through public services and social programmes. |
| Welfare Payments | Welfare payments can help reduce income inequality by providing financial support to low-income individuals and families, thereby increasing their disposable income and improving their standard of living. |
| Minimum wage | Implementing a minimum wage can reduce income inequality by ensuring that workers receive a basic level of pay, which helps to lift the lowest earners out of poverty. |
| Trade Unions | Trade unions can help reduce income inequality by negotiating better wages and working conditions for their members, particularly for low- and middle-income workers. |
| Distribution of assets | The distribution of assets, such as property and financial investments, can influence income inequality. Policies that promote more equitable asset distribution can help reduce inequality. |
Equality vs Equity in Income & Wealth Distribution
Equality: Everyone receives an equal share of resources or opportunities. This is objective and measurable.
Equity: Everyone receives a "fair" share of resources. This is subjective and open to debate.
Deciding on the "equitable" distribution of income and wealth across an economy is a matter for debate, and different groups/individuals have differing opinions on the matter:
- Socialists argue that income and wealth should be distributed more equally, with a focus on reducing the gap between the rich and poor.
- Capitalists argue that income and wealth distribution should be based on merit and individual effort, with less emphasis on equality.
- Libertarians argue that income and wealth distribution should be determined by free market forces, with minimal government intervention, and that individuals should be free to keep the wealth they earn.
The Impact of Economic Development: The Kuznets Curve
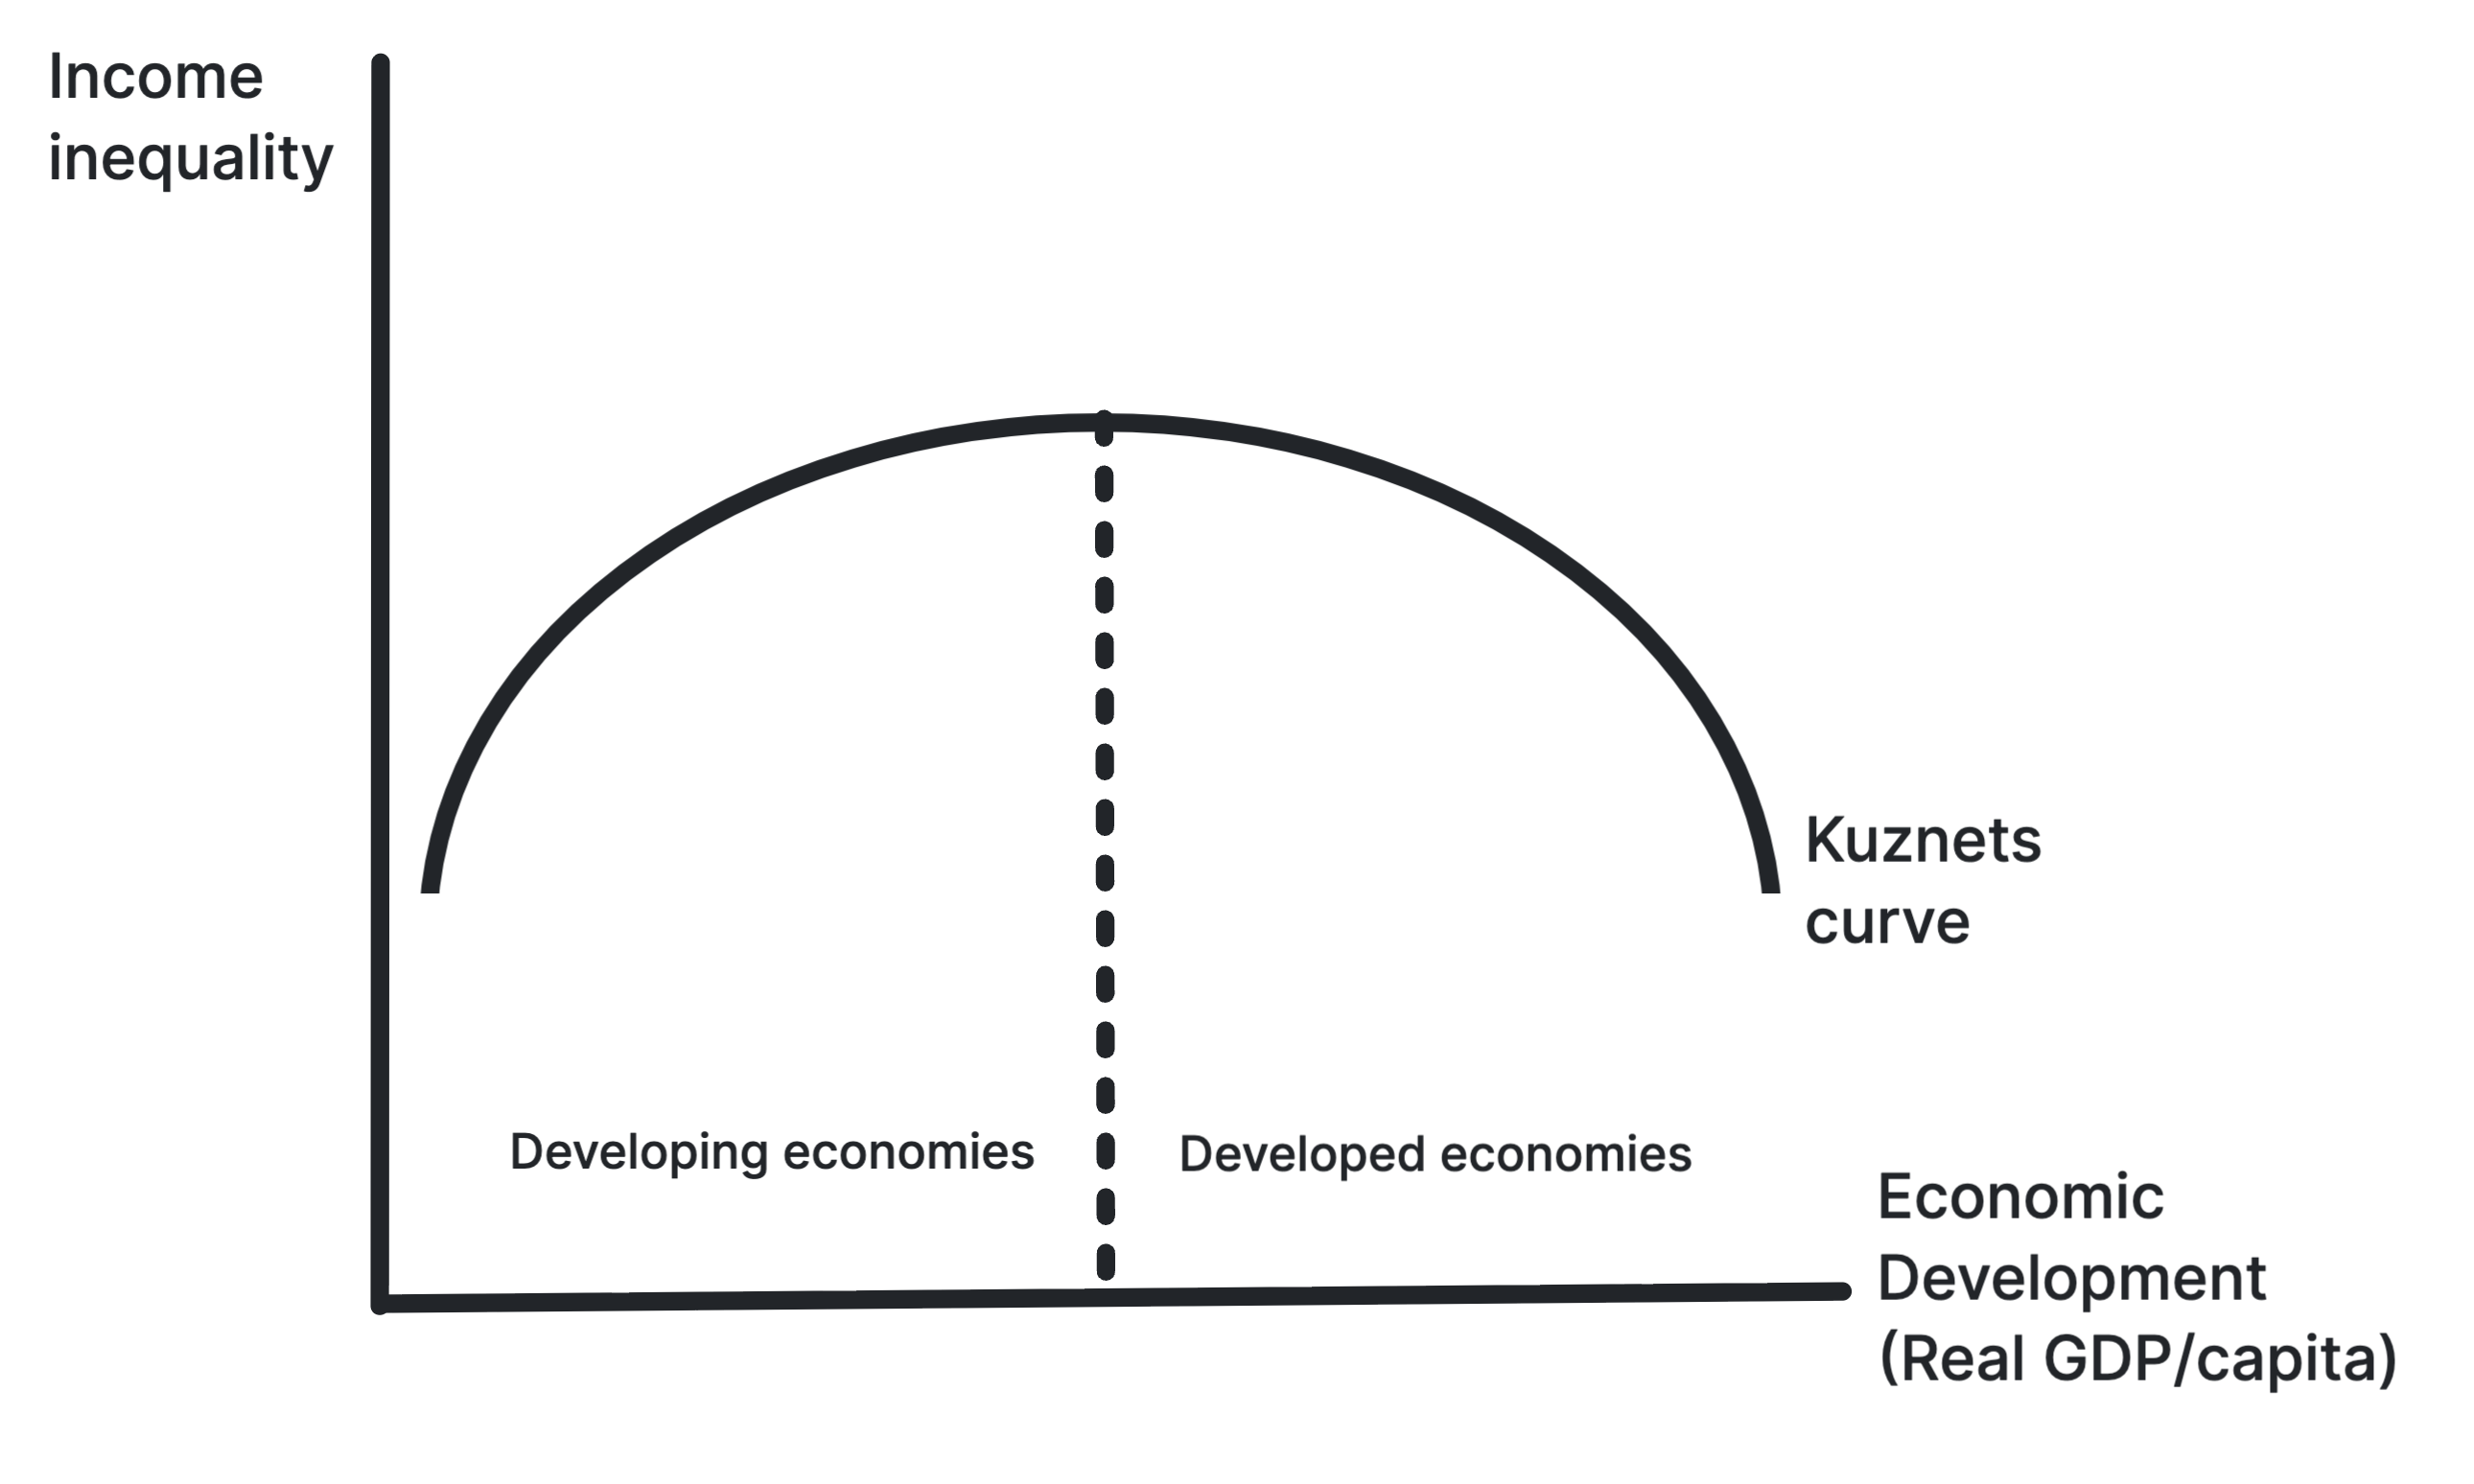
The Kuznets Curve hypothesis suggests that as an economy develops, inequality first rises and then falls after a turning point.
In the early stages of development, structural changes in the economy, such as urbanisation and industrialisation, can lead to increased inequality as the individuals that benefit from the industrial sector earn higher incomes than those in the agricultural sector.
However, as development continues, wealth distribution may improve due to factors such as increased access to education, social mobility, and government intervention through progressive taxation and welfare programmes.
Benefits and Costs of Inequality
| Benefits of Inequality | Costs of Inequality |
|---|---|
| Incentives for Work and Entrepreneurship: Some inequality incentivises individuals to work harder, innovate, and take risks, which can lead to economic growth and increased productivity. | Disincentives for Work and Entrepreneurship: Extreme inequality can demotivate individuals who perceive the system as unfair, leading to reduced effort and productivity. |
| Human Capital: Encourages investment in education and skill development, as individuals seek to improve their earning potential. | Social Immobility: Can result in reduced social mobility, as those from disadvantaged backgrounds may have limited access to education and opportunities for advancement. |
| Efficient Allocation of Resources: Can lead to a more efficient allocation of resources, as individuals are rewarded based on their contributions to the economy. | Living Standards: Can exacerbate health disparities, as those with lower incomes may have limited access to healthcare and nutritious food, leading to poorer health outcomes. |
Stuck on this topic? Work through it with an online A-Level Economics tutor in a free 15-minute intro call, or send an essay on it for A-Level Economics essay marking.