Inequality
These Edexcel A-Level Economics revision notes cover unit 4.2.2, explaining how income and wealth inequality are measured using the Lorenz curve and Gini coefficient, the causes of widening inequality, and the trade-offs involved in using taxation, transfers, and labour market policy to reduce it.
Key Definitions
Income inequality is the unequal distribution of earnings, such as wages, rent, interest, and profit. It is a flow.
Wealth inequality is the unequal distribution of assets, such as property, shares, and savings. It is a stock.
Measuring Inequality: Lorenz Curve and Gini Coefficient
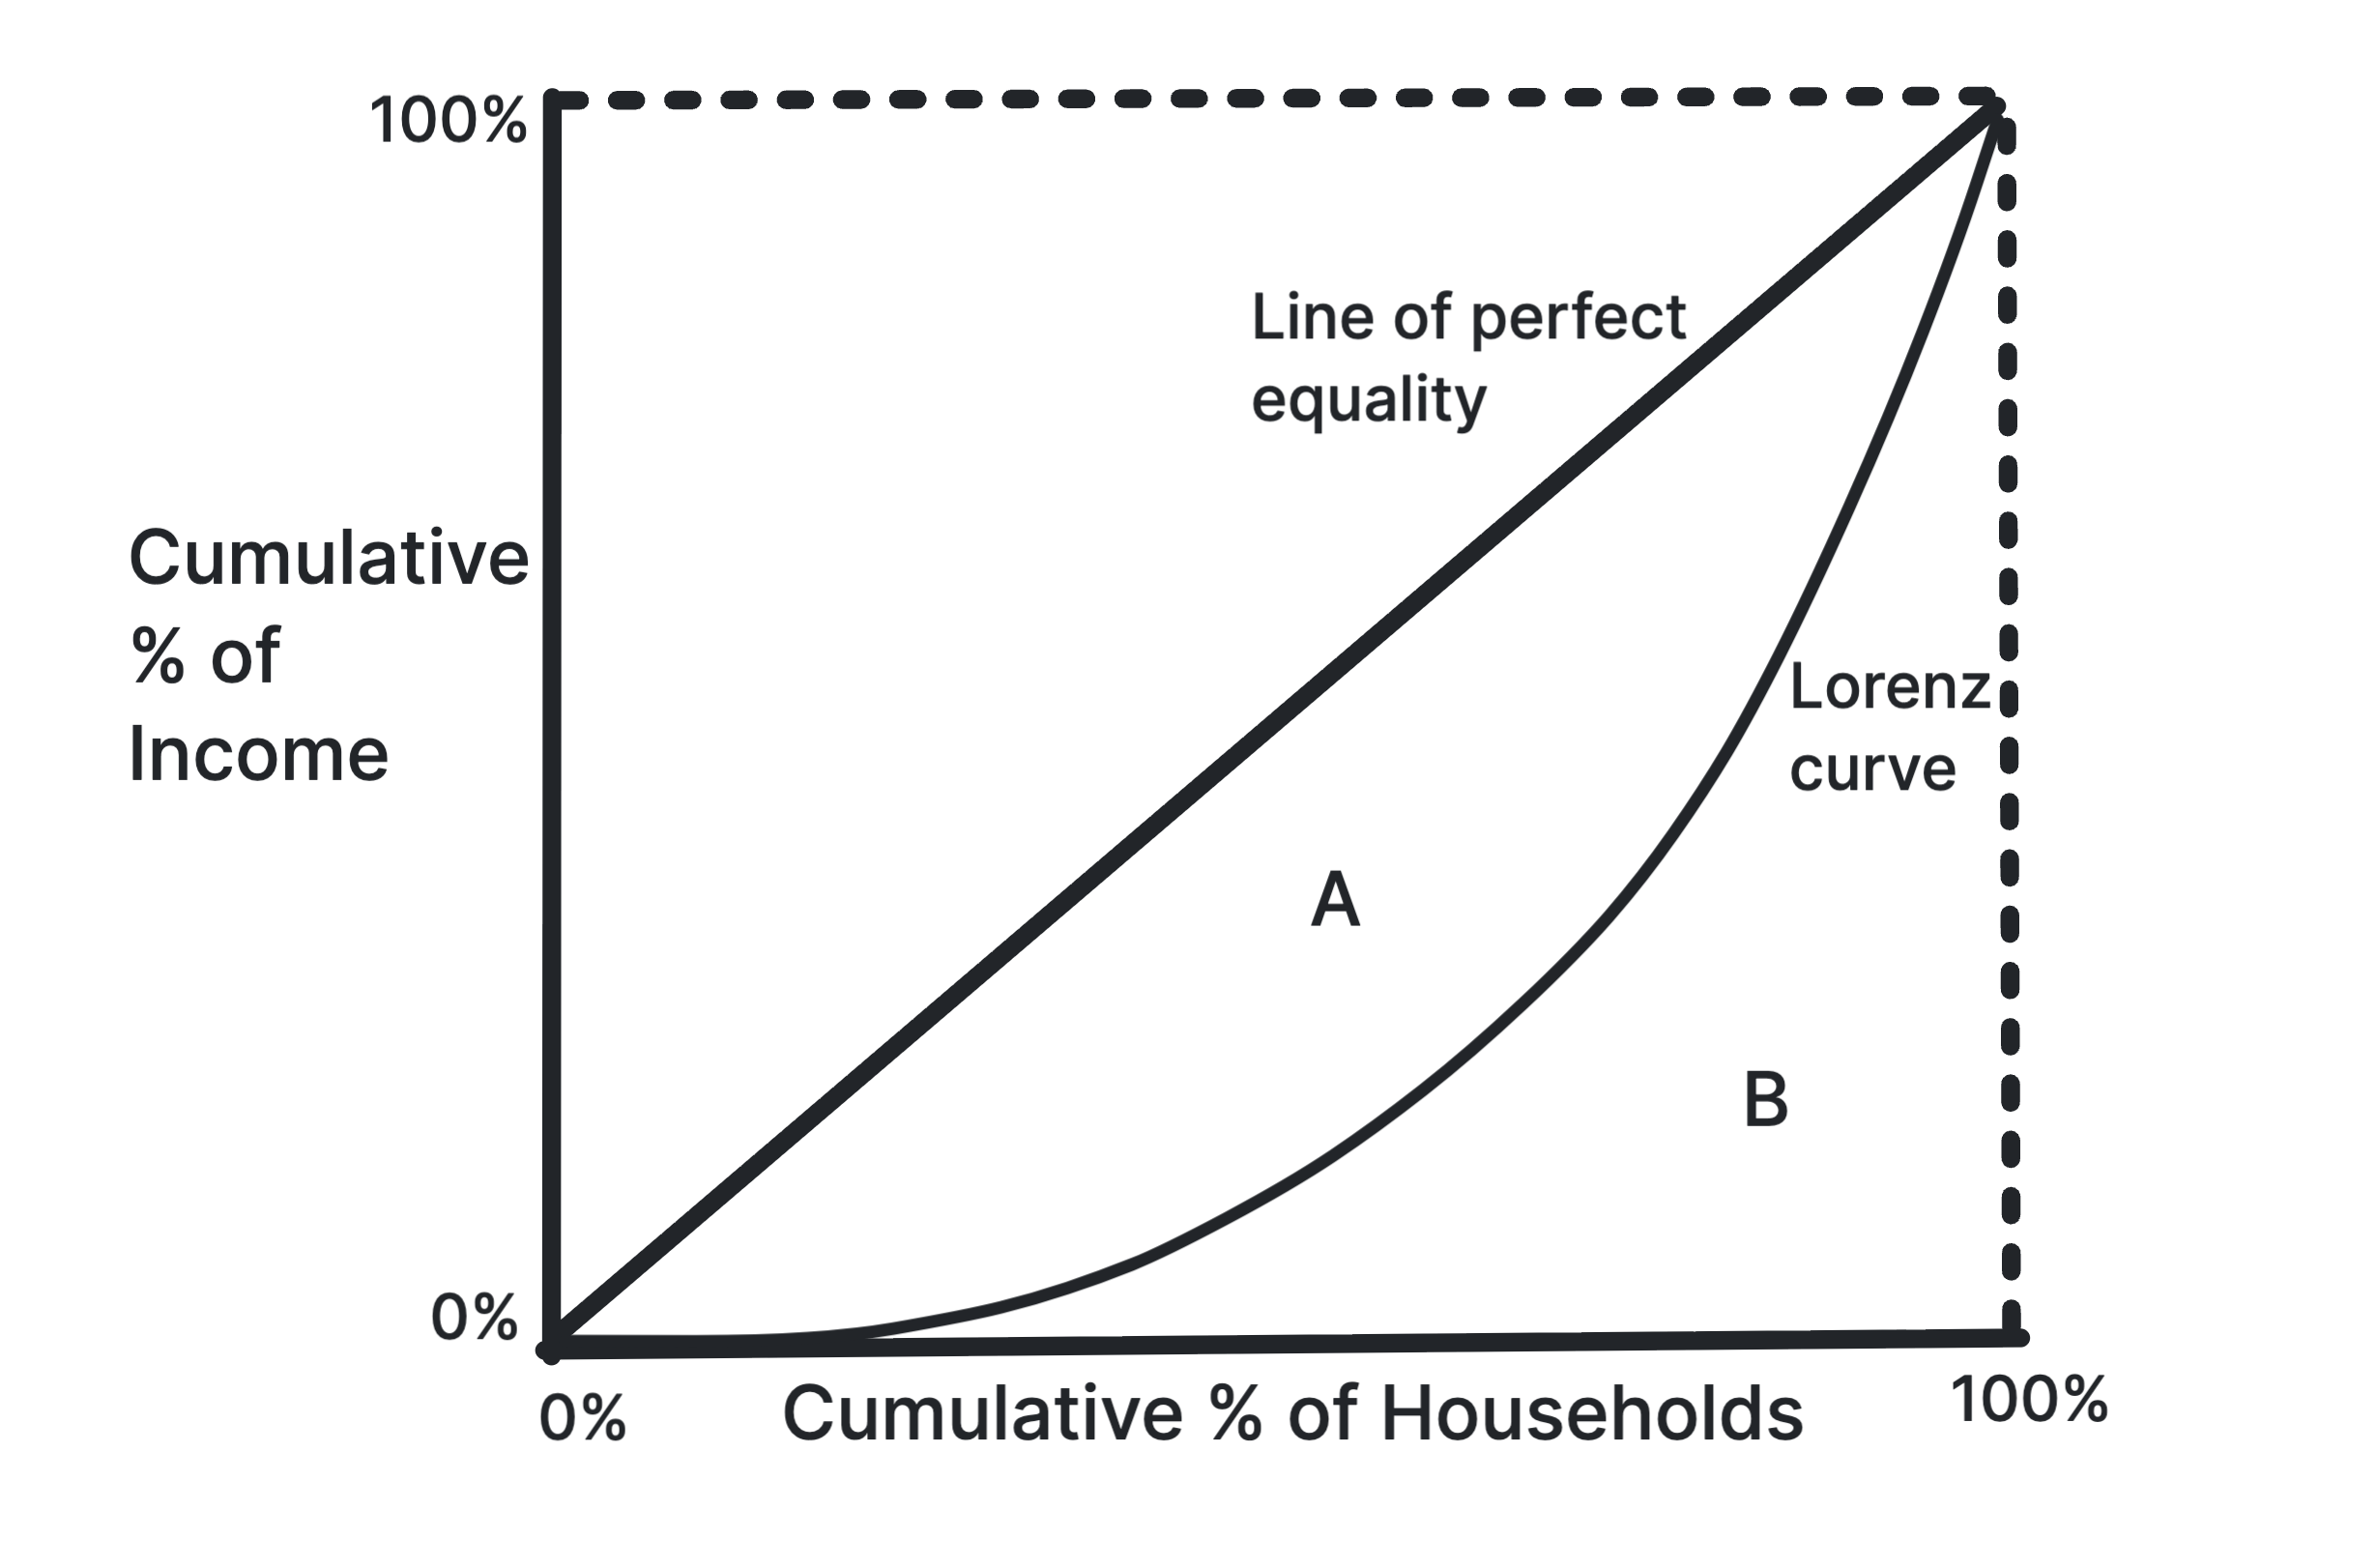
The Gini coefficient is a numerical measure of inequality:
\[ \text{Gini Coefficient} = \frac{A}{A + B} \]
- 0 means perfect equality.
- 1 means perfect inequality.
- A higher Gini coefficient indicates greater inequality.
Causes of Income and Wealth Inequality
| Factor | Effect on Inequality |
|---|---|
| Differences in education and skills | Higher skills often lead to higher wages, increasing inequality. |
| Strength of trade unions | Stronger unions can raise workers' wages and reduce inequality. |
| Wage rates and employment laws | Measures such as the National Minimum Wage can reduce inequality, while weak labour laws may increase it. |
| Tax and benefit system | Progressive taxes and generous welfare benefits reduce inequality. |
| Asset ownership and wealth | Wealth generates more income through rent, dividends, and capital gains, so inequality can widen over time. |
The Impact of Economic Development: The Kuznets Curve
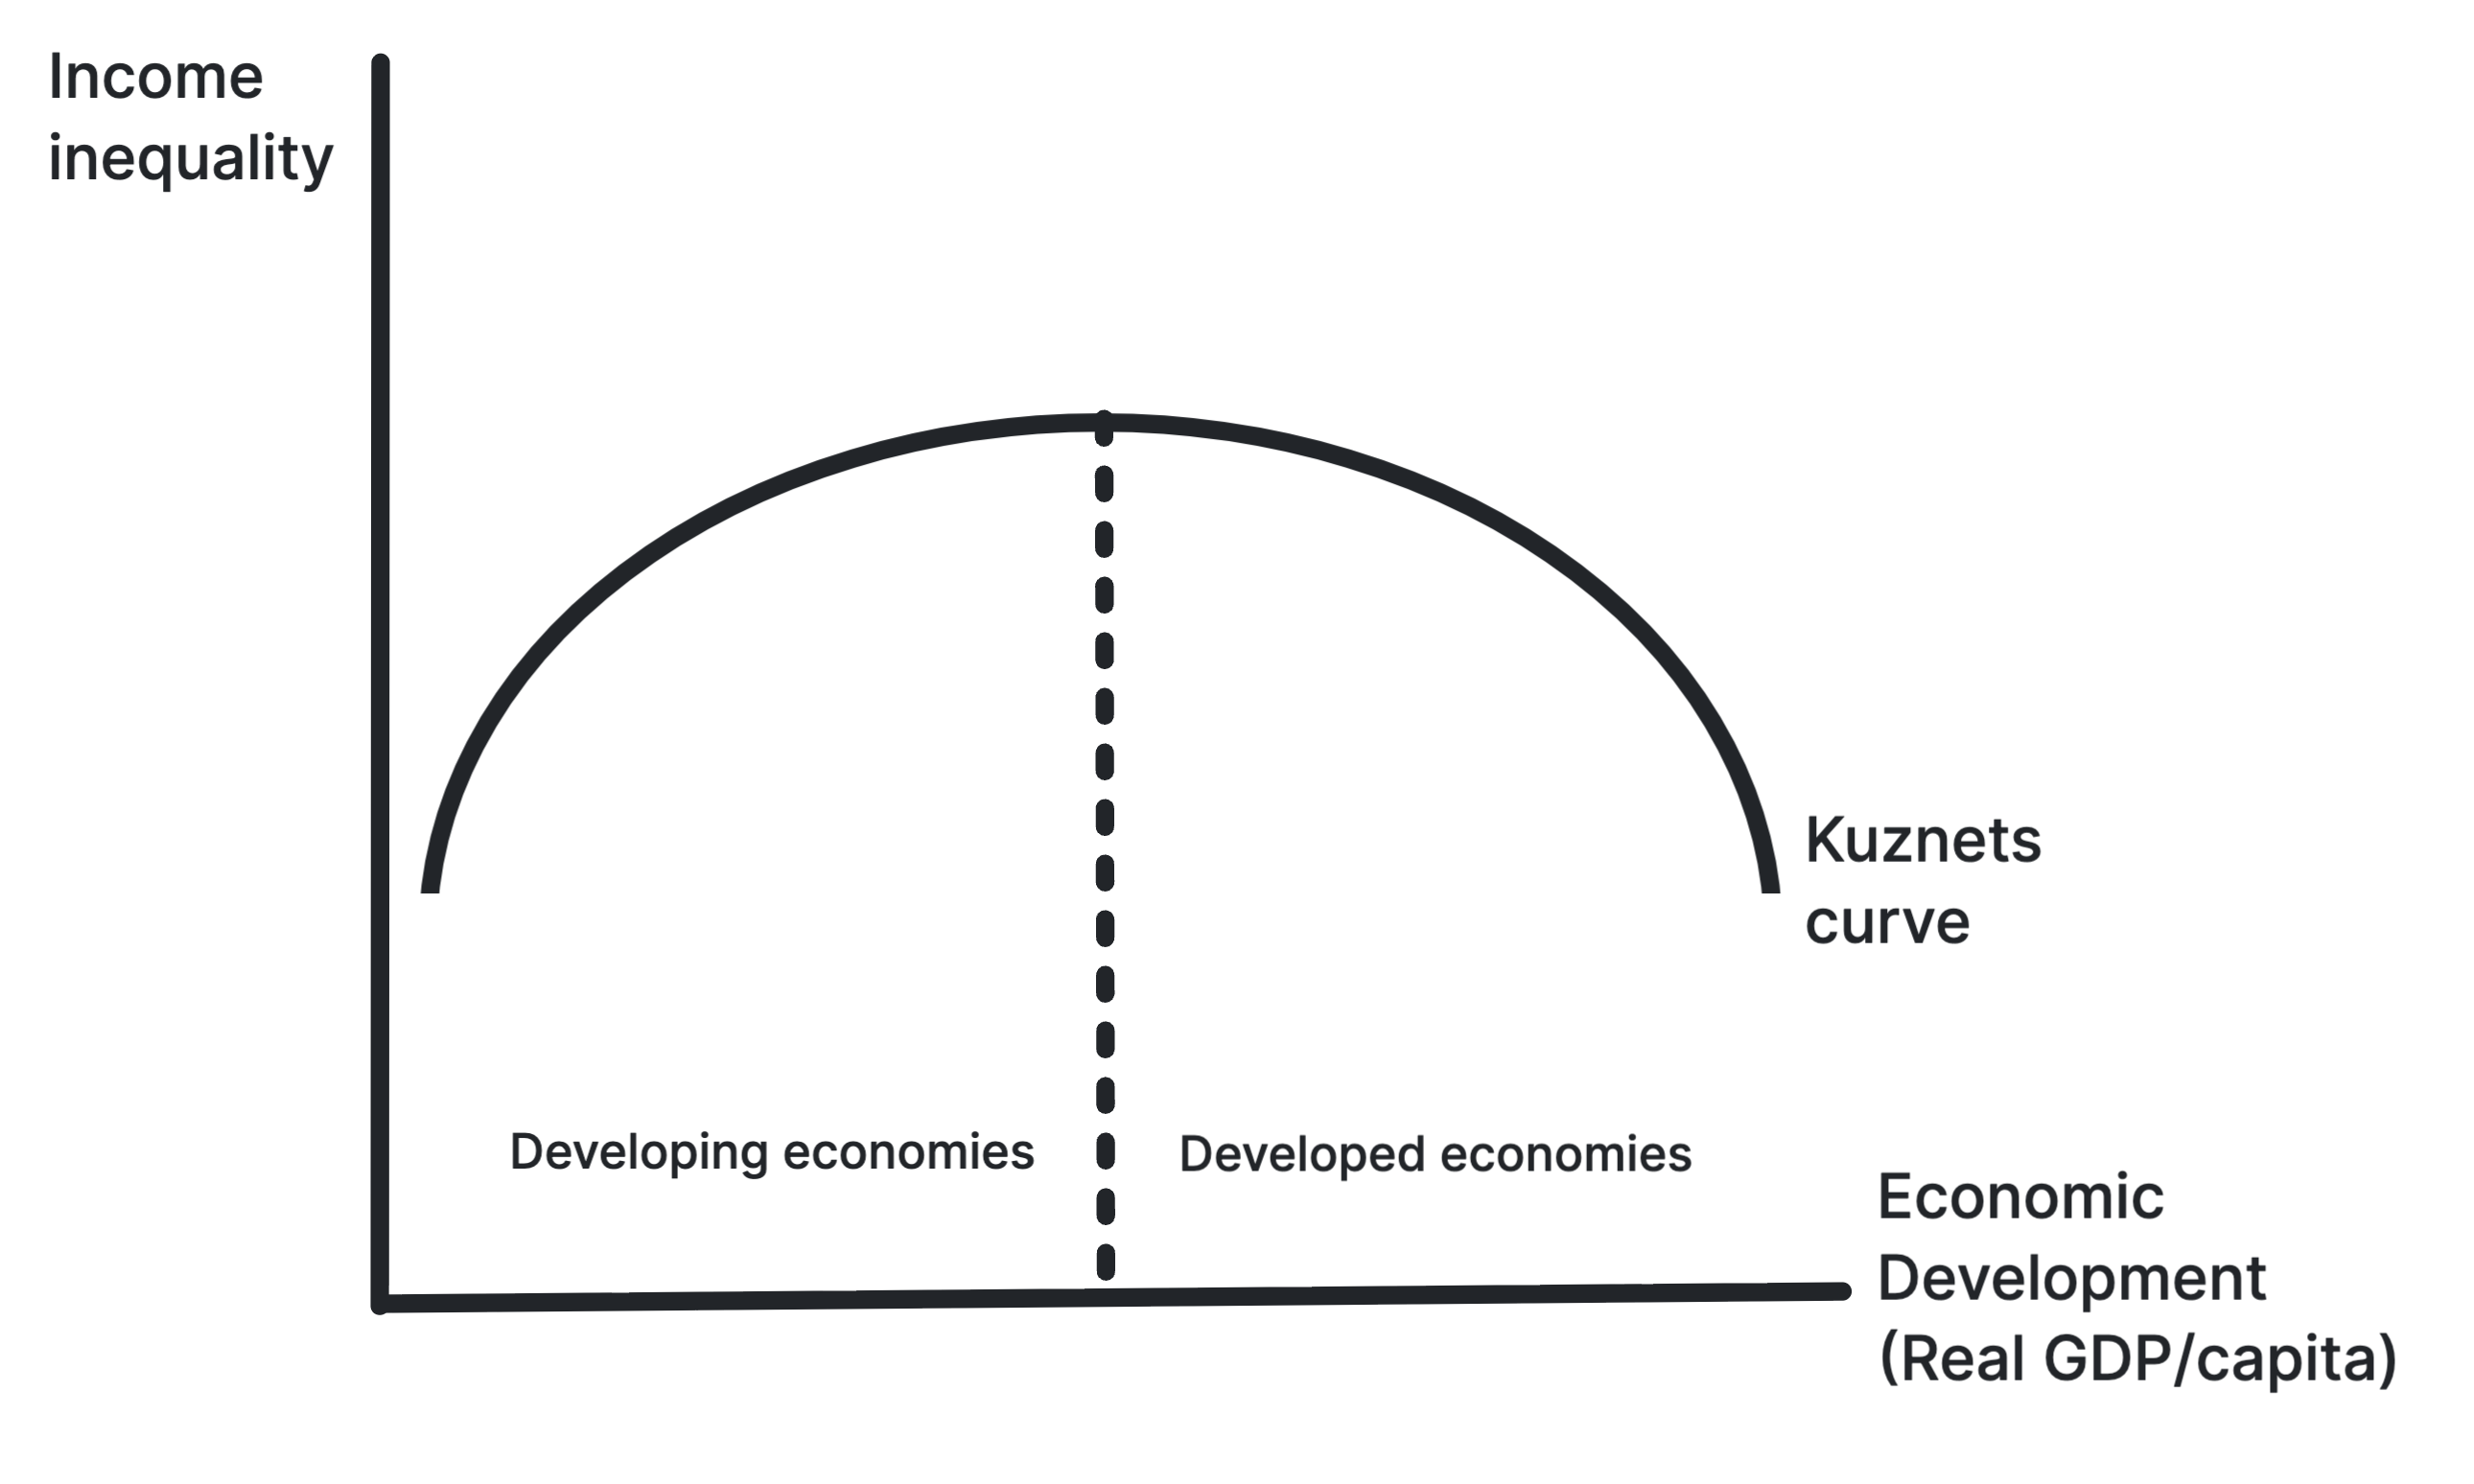
The Kuznets Curve hypothesis suggests that as an economy develops, inequality first rises and then falls after a turning point.
The argument is that development initially shifts labour from low-income agriculture to higher-income industry, increasing inequality, before broader wealth distribution and government intervention reduce it later on.
Capitalism and Inequality
- Capitalism tends to generate inequality because individuals differ in skills, entrepreneurship, and asset ownership.
- The profit motive and incentives can improve efficiency and growth, but they may also lead to concentrated wealth.
- This creates a case for government intervention, such as progressive taxation, welfare provision, and better access to education, while still preserving incentives.
Exam Preparation
- Distinguish clearly between income and wealth inequality.
- Draw, label, and interpret the Lorenz Curve and calculate the Gini coefficient.
- Analyse the causes of inequality using examples such as education, wage differences, tax systems, and asset ownership.
- Explain the Kuznets curve as a hypothesis, not a rule that always applies.
- Evaluate the relationship between capitalism, incentives, inequality, and the role of government.