Oligopoly
These Edexcel A-Level Economics revision notes cover unit 3.4.4, analysing oligopoly — a market dominated by a few large firms — including the kinked demand curve model, strategic interdependence, game theory, and why firms may collude or compete on non-price factors.
Key Characteristics
- There is a high concentration ratio, with a few large firms dominating the market.
- There are high barriers to entry and exit, such as high start-up costs, sunk costs, and economies of scale.
- Firms are interdependent, so the decisions of one firm affect rivals and vice versa. This is the core feature of oligopoly.
- Products are usually differentiated.
Concentration Ratios
A concentration ratio measures the degree of market concentration.
For example, a 5-firm concentration ratio of 80% means that the top five firms account for 80% of total market sales.
A high ratio means the market is more concentrated and generally less competitive.
Calculation: \[ \frac{\text{Total sales of top } n \text{ firms}}{\text{Total market sales}} \times 100 \]
Collusive and Non-Collusive Behaviour
Because firms are interdependent, they must decide whether to collude or compete.
Collusion
Collusion takes place when firms agree, formally or informally, to restrict competition.
- Overt collusion: A formal agreement, such as a cartel like OPEC. This is illegal.
- Tacit collusion: An informal understanding, such as price leadership, where one firm sets a price and others follow.
- Aim: To act like a monopoly by raising price, restricting output, and earning supernormal profit.
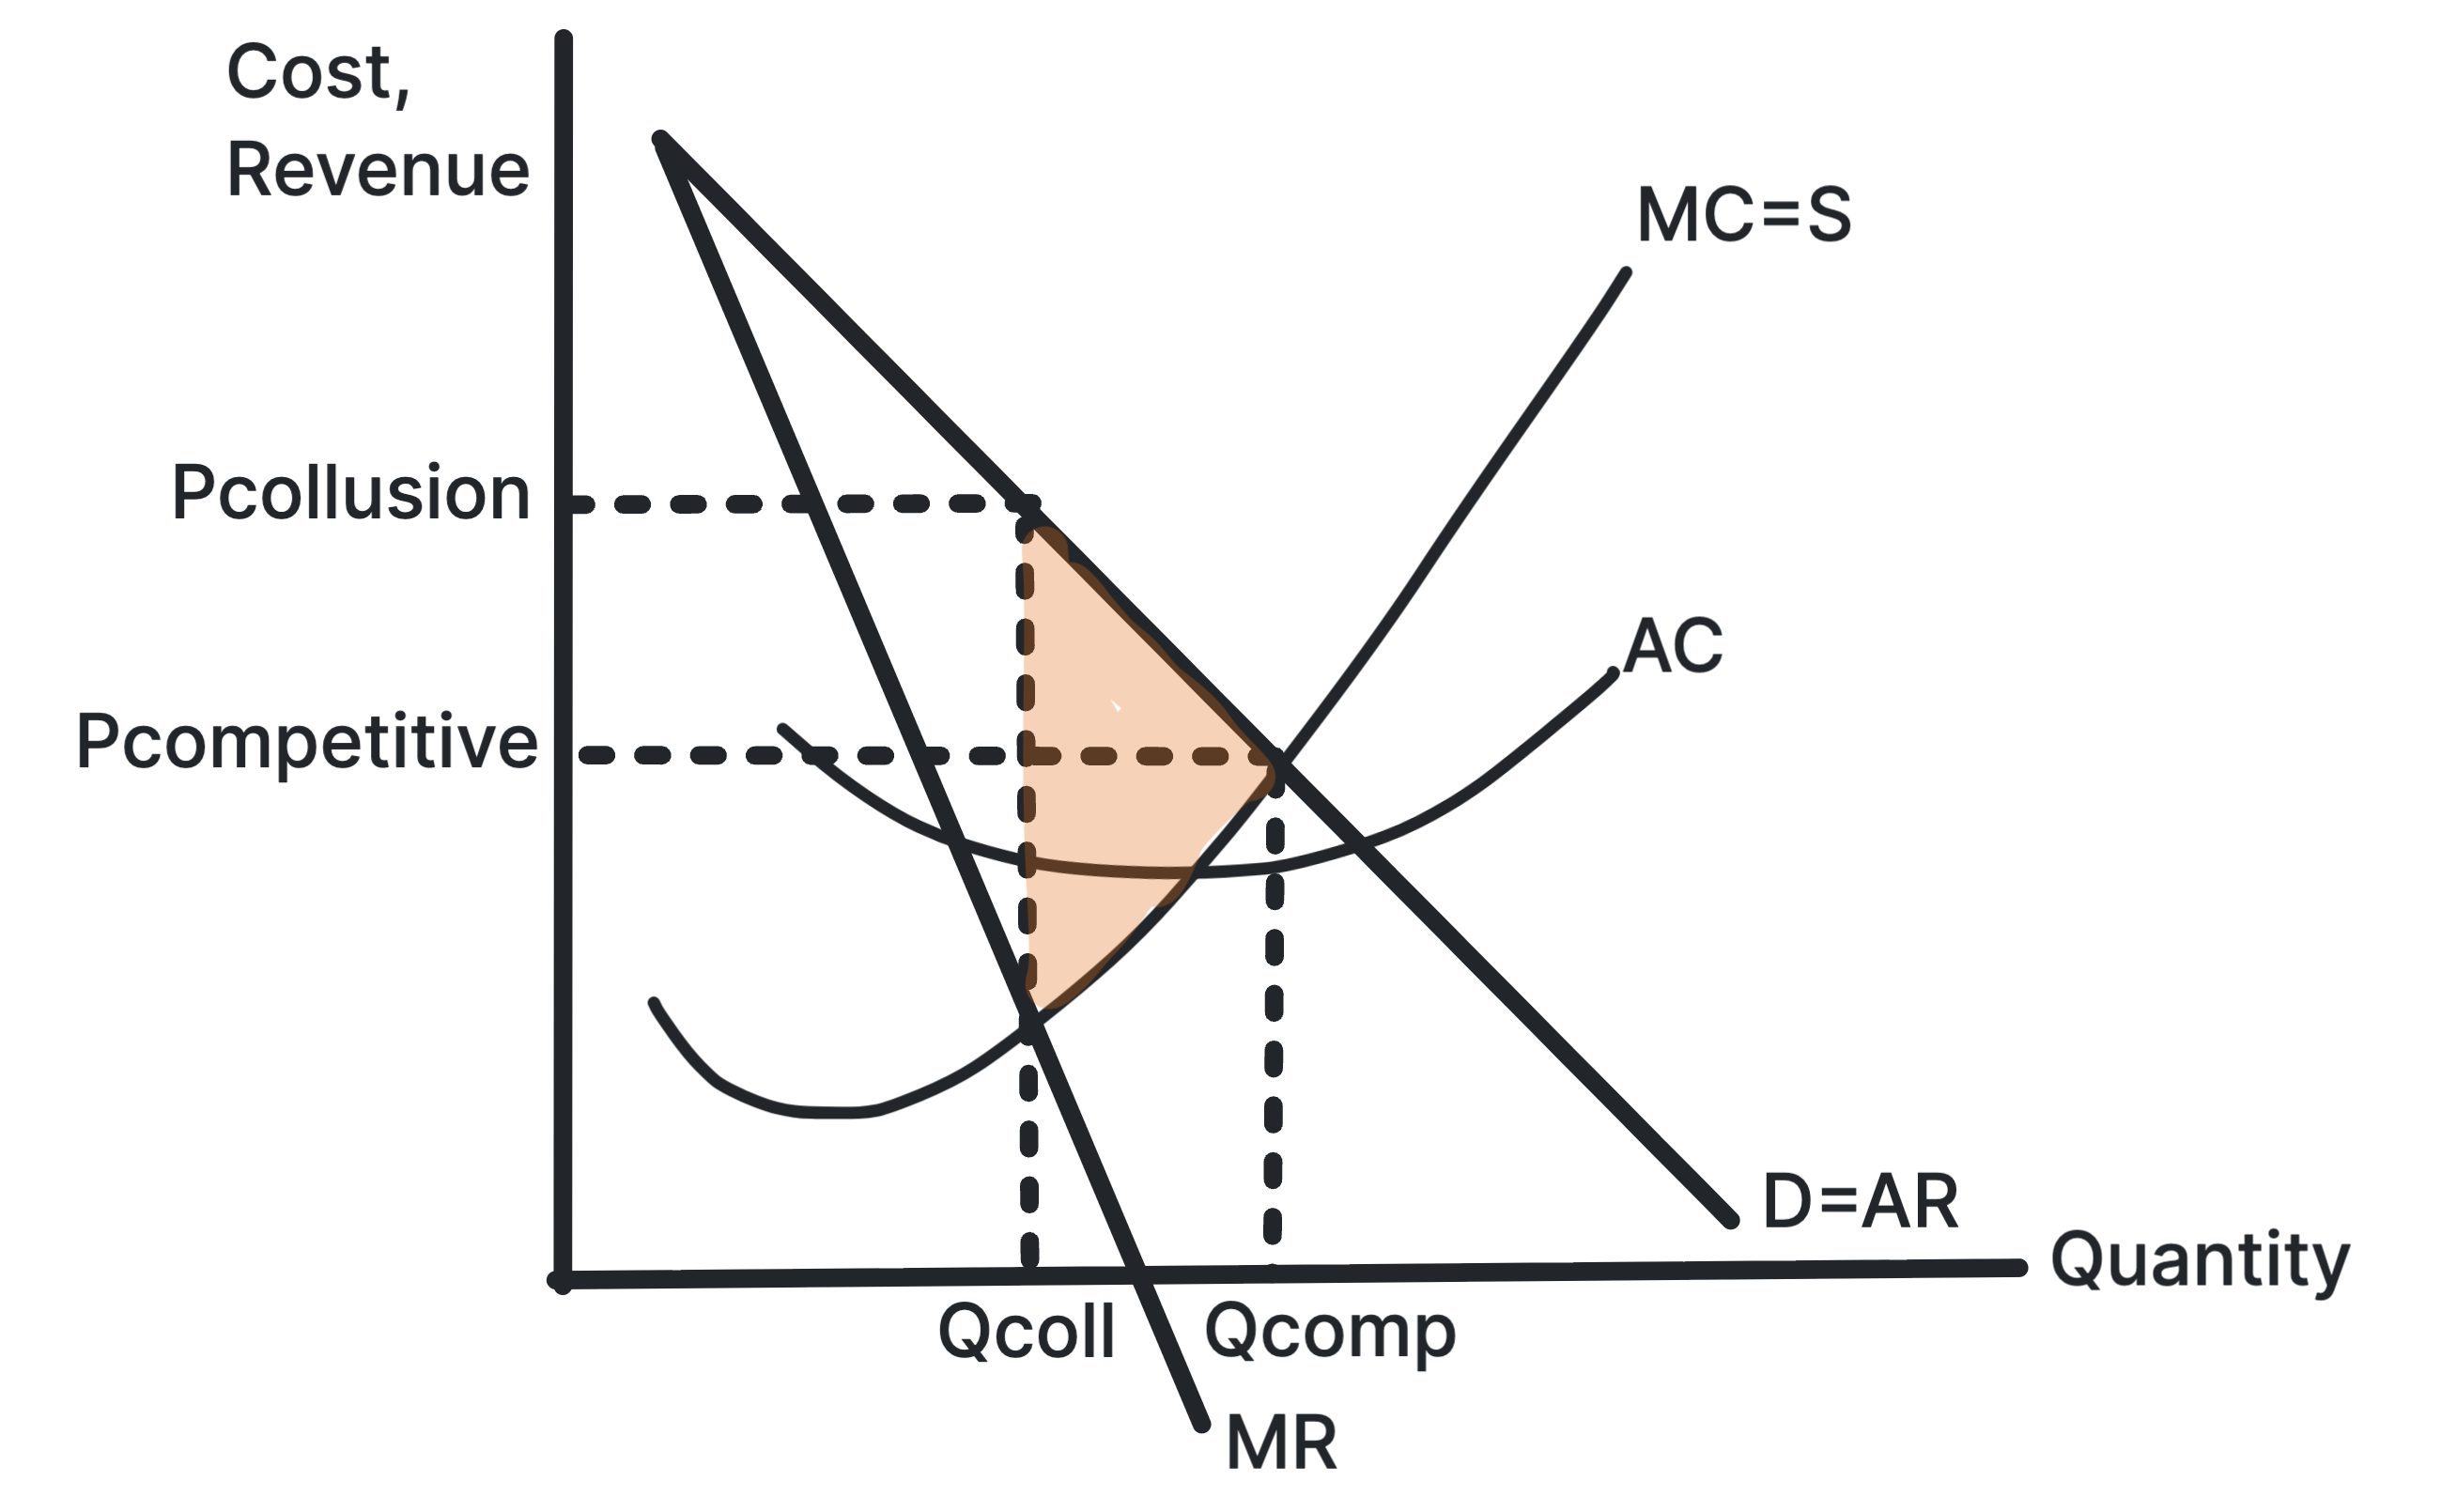
The diagram shows how collusion can lead to a higher price and lower output compared to a competitive market. The area of supernormal profit is the shaded rectangle between the collusive price and the average cost curve at the collusive output.
Non-Collusive Behaviour
In non-collusive behaviour, firms actively compete, often through non-price competition.
Game Theory and the Prisoner's Dilemma
Game theory analyses strategic decision-making under interdependence.
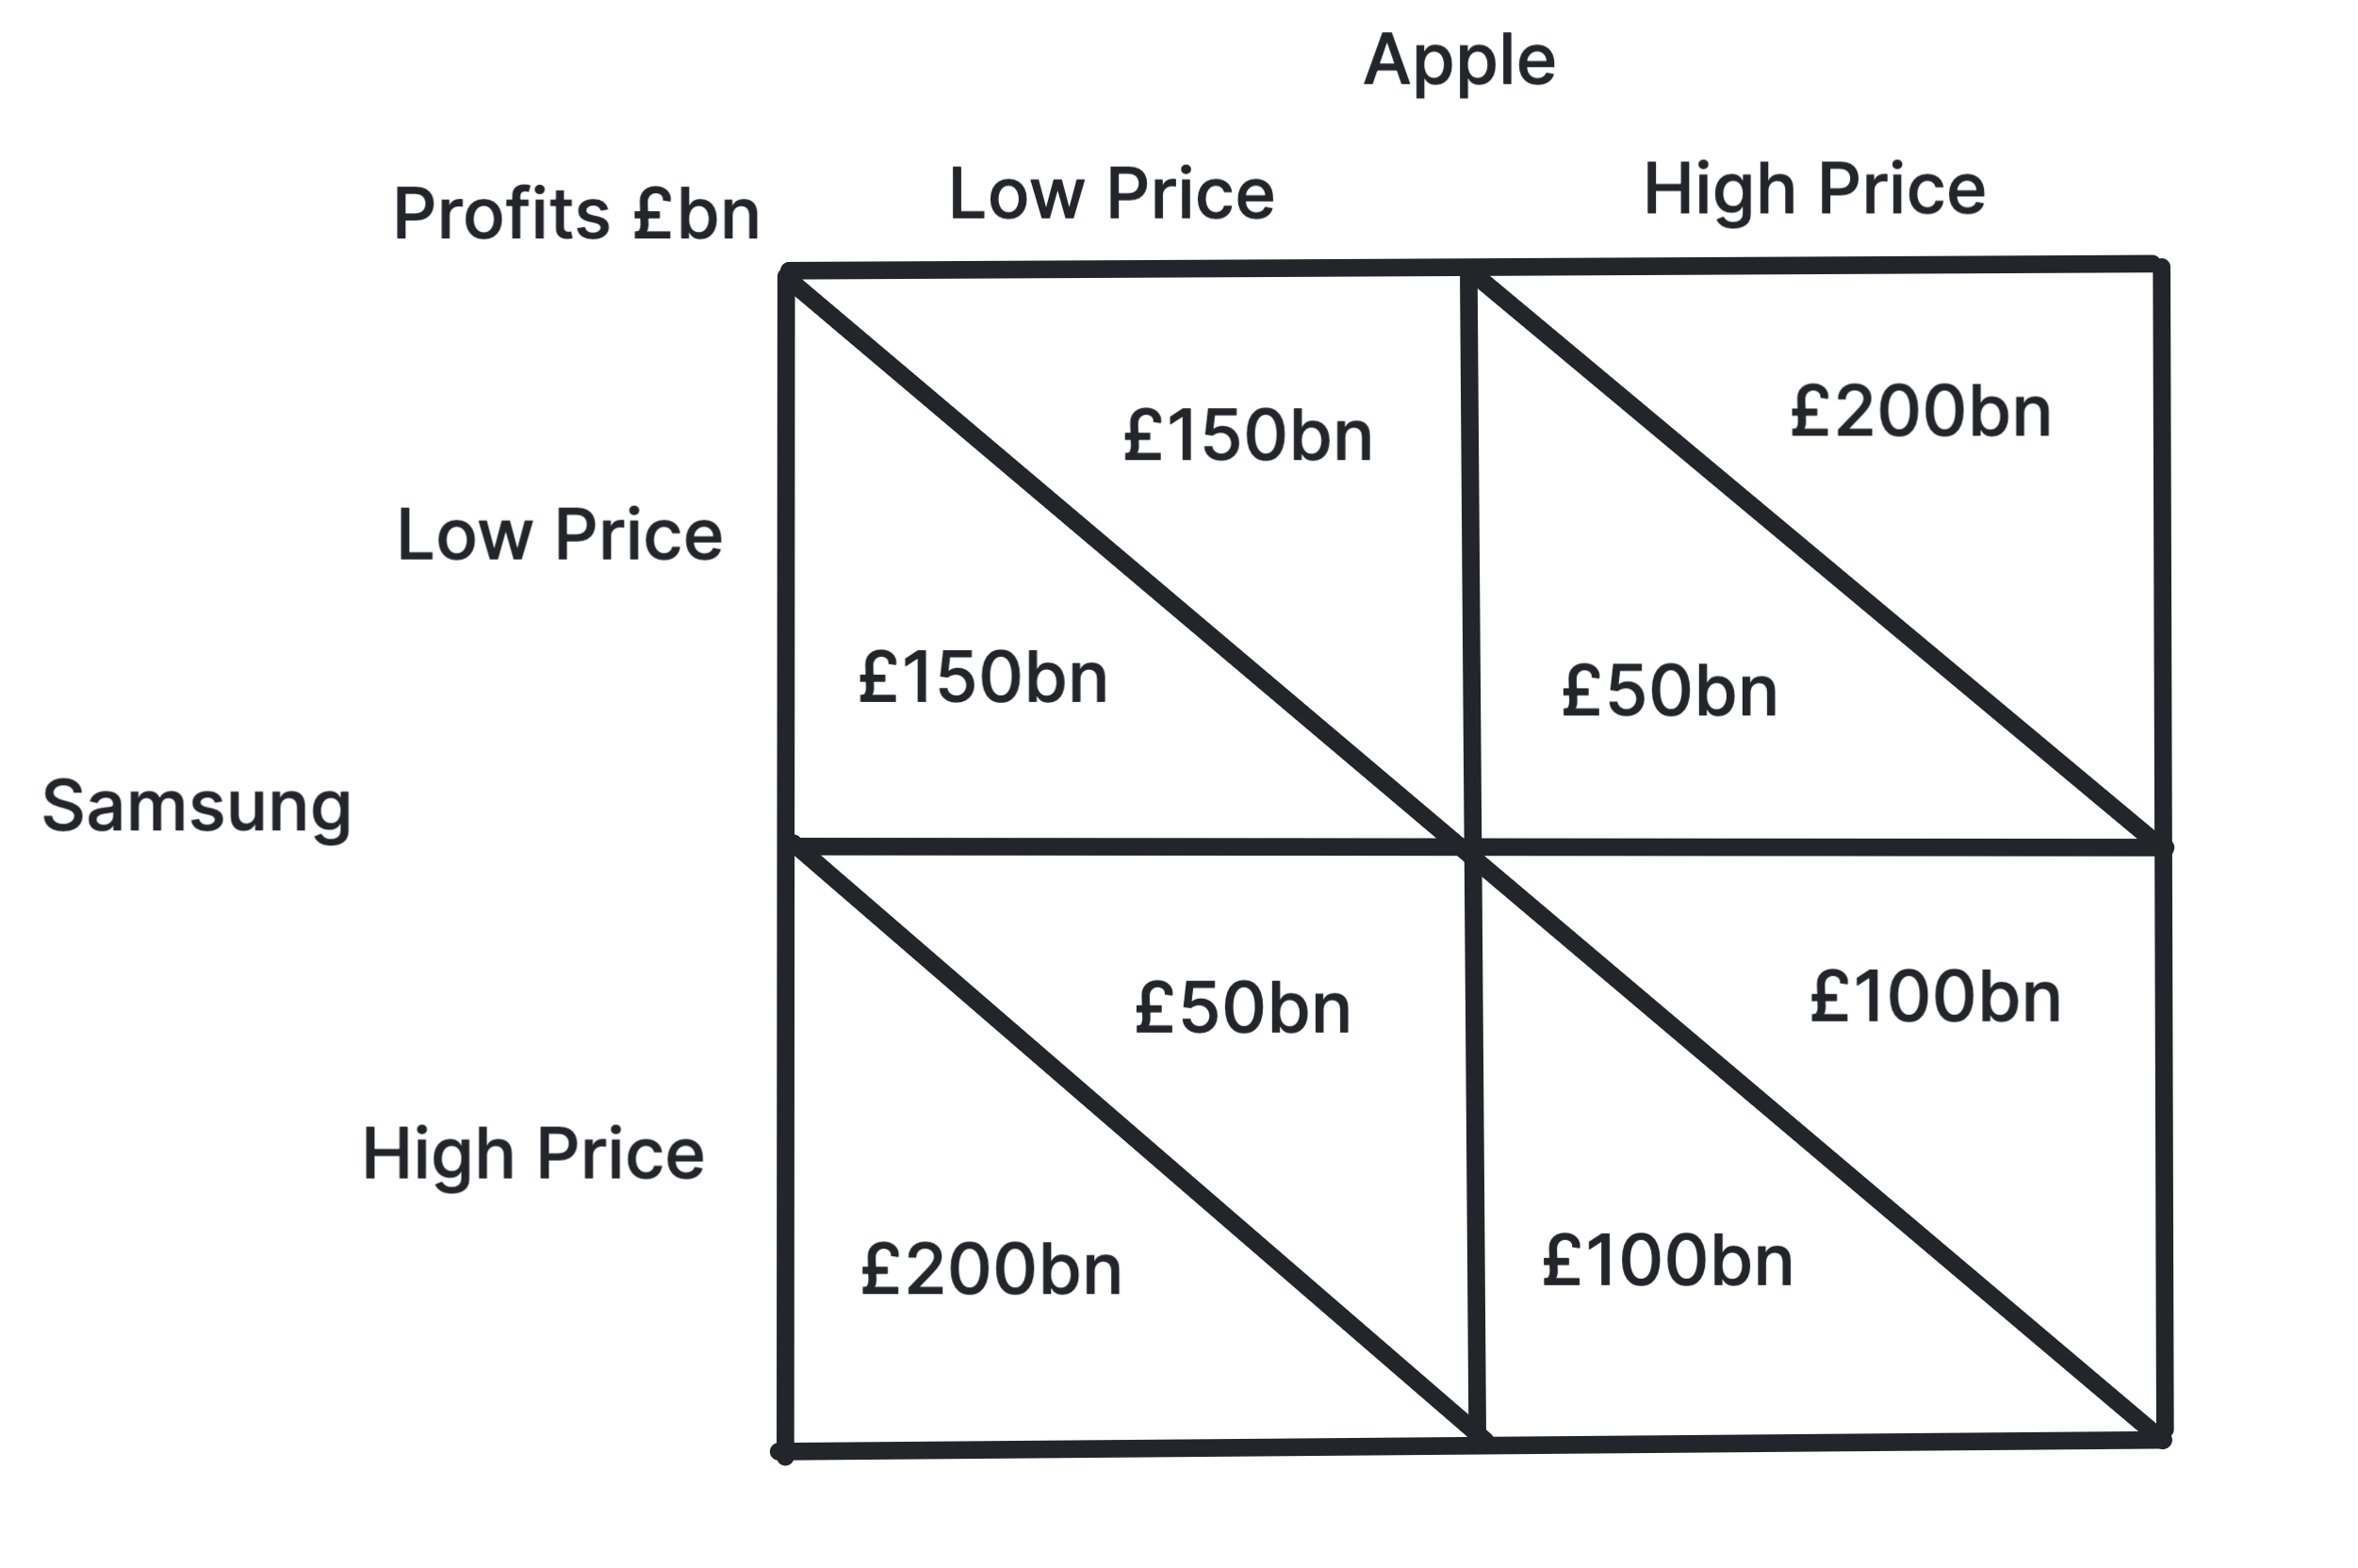
A key insight is that even when collusion would benefit both firms, the incentive to compete for short-run gain can push firms toward a more competitive outcome.
In this example, both firms have a dominant strategy to charge a low price, leading to a Nash equilibrium where both earn lower profits than if they had colluded to charge a high price.
Types of Competition
Price Competition
- Price war: Repeated price cuts to undercut rivals, which damages profits for all firms.
- Predatory pricing: Temporarily setting price below cost to drive out a competitor. This is often illegal.
- Limit pricing: Setting price low enough to deter new entrants.
Non-Price Competition
Non-price competition is very common in oligopoly and includes:
- advertising and branding
- loyalty schemes
- product differentiation and innovation
- customer service, warranties, and packaging
The Kinked Demand Curve Model
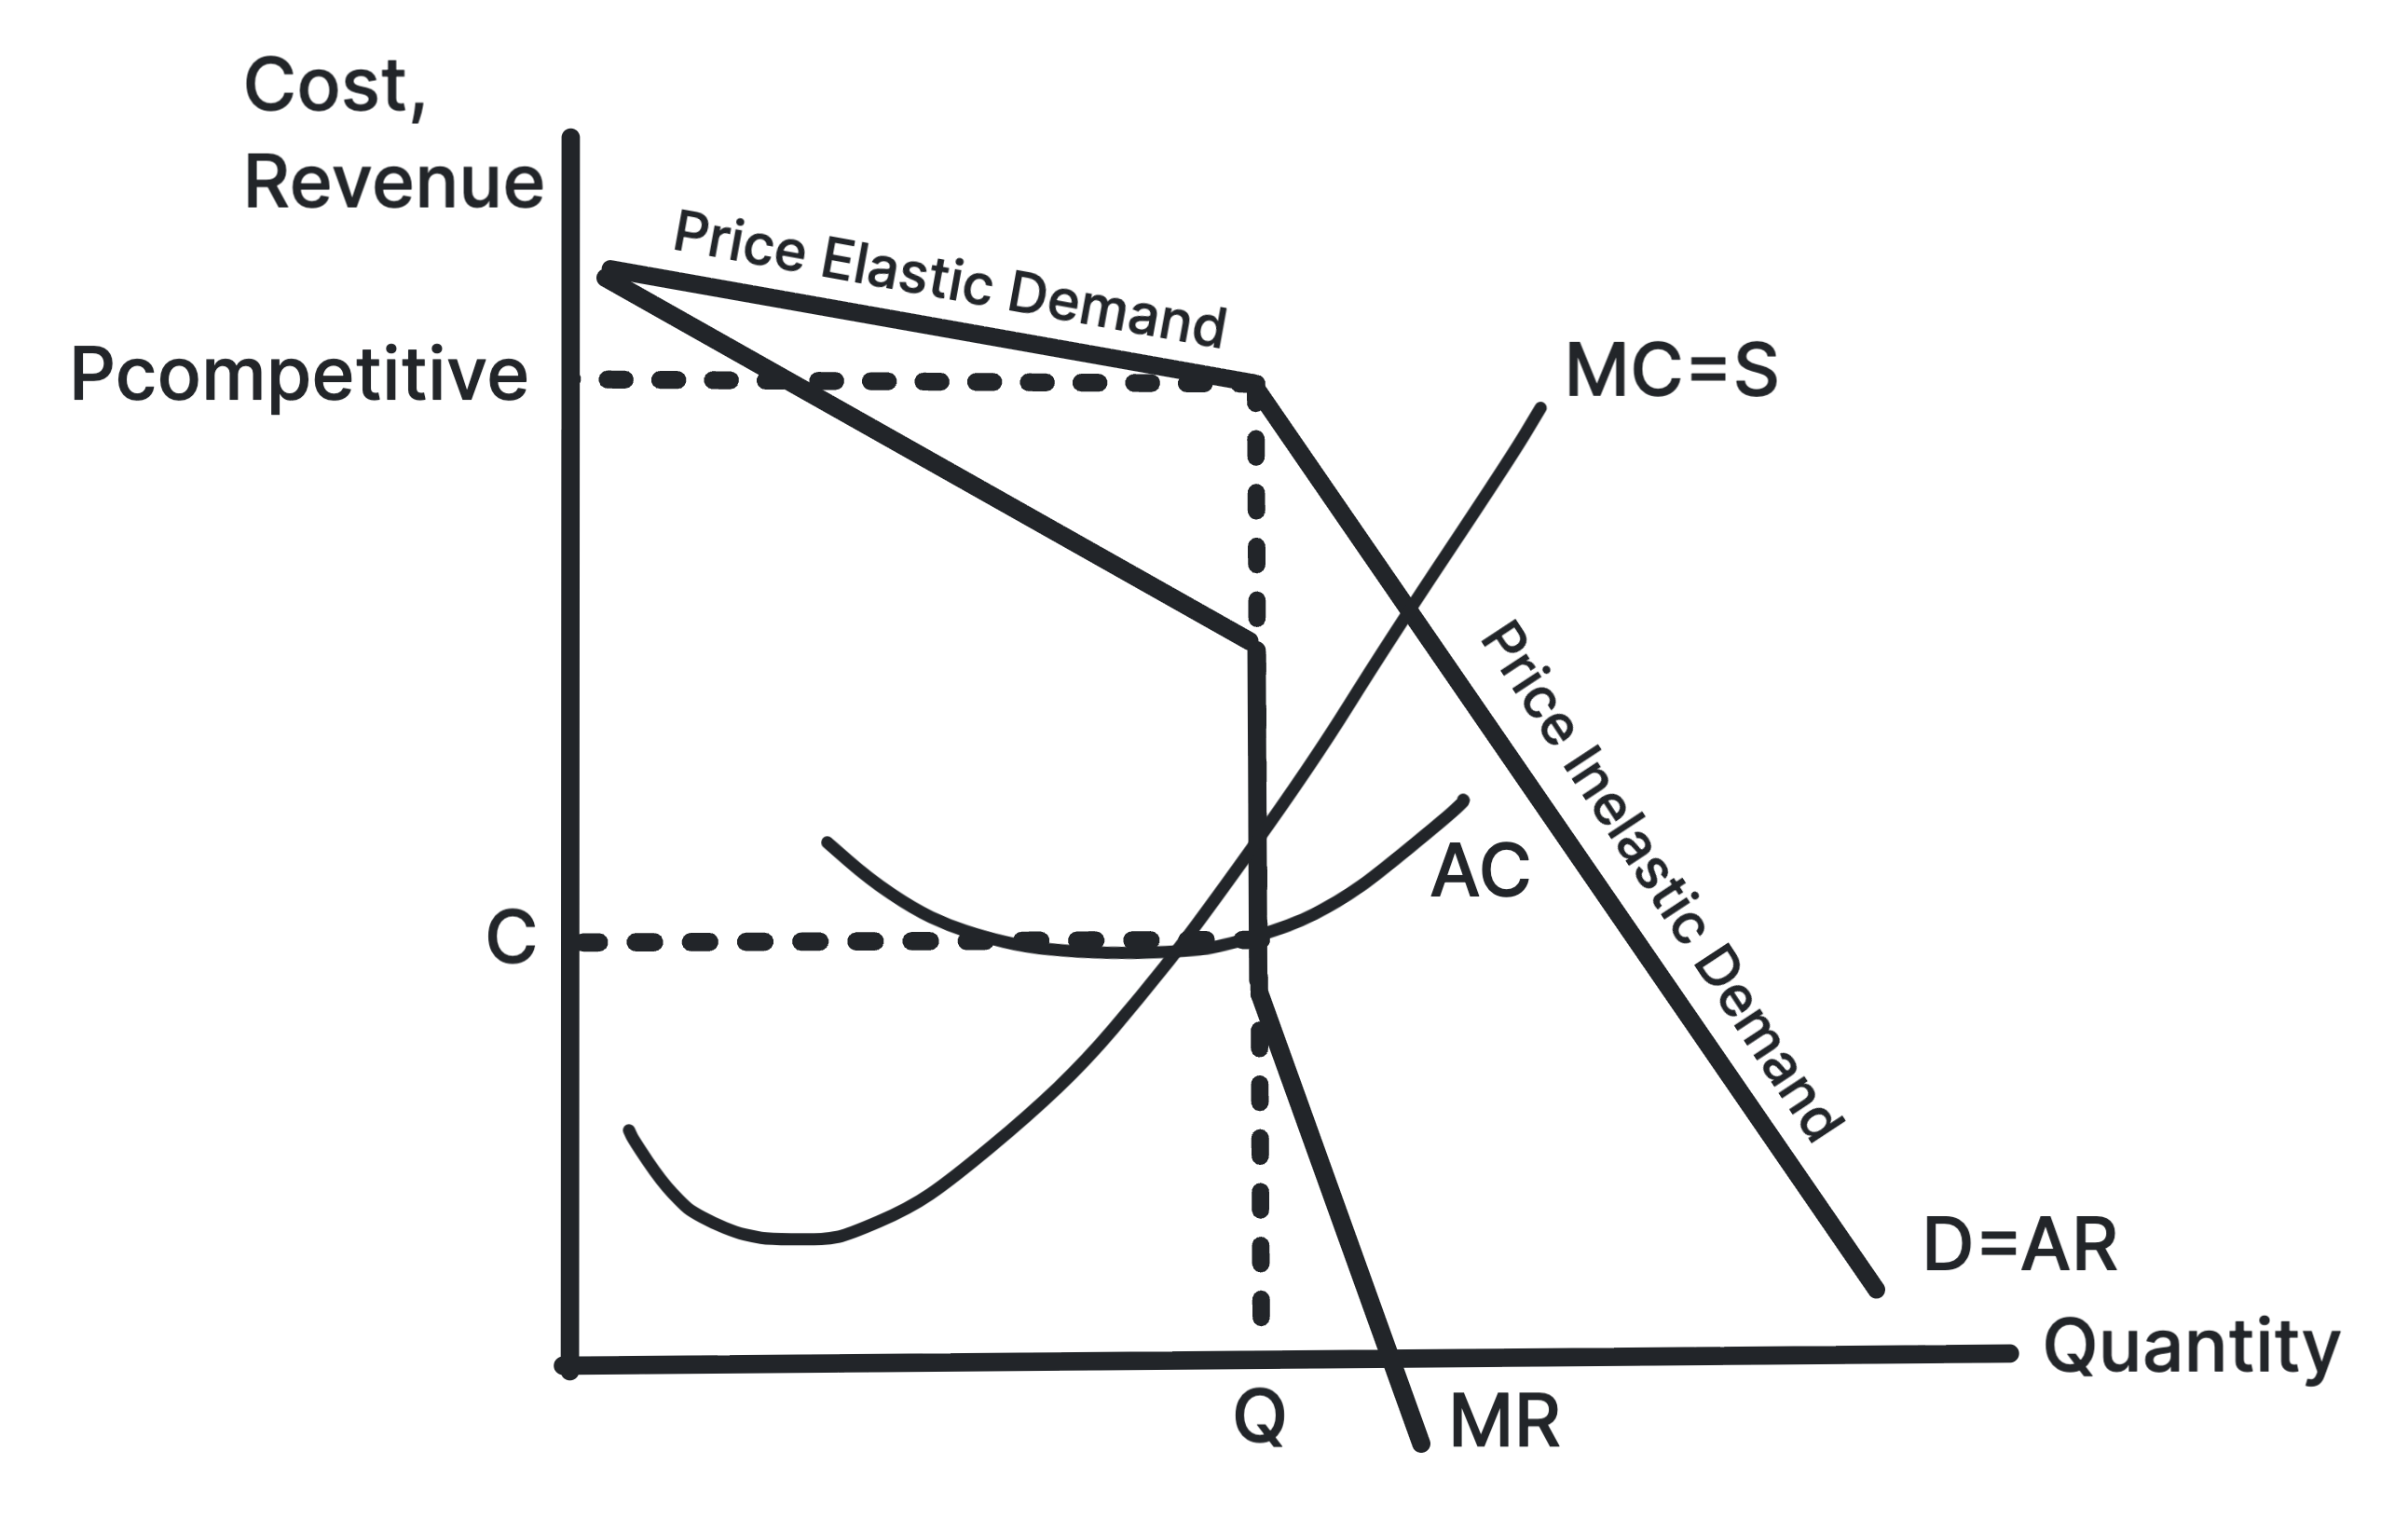
The kinked demand curve model is a common explanation for price rigidity in non-collusive oligopoly.
If a firm raises price, rivals may not follow, so the firm loses many customers and demand is relatively elastic.
If a firm lowers price, rivals may match the price cut, so it gains few extra customers and demand is relatively inelastic.
This creates a kinked demand curve and a discontinuous MR curve.
Exam Preparation
- Define oligopoly and highlight interdependence as its core feature.
- Calculate and interpret concentration ratios.
- Distinguish between collusive and non-collusive behaviour using examples.
- Draw and interpret a Prisoner's Dilemma payoff matrix, including the dominant strategy and Nash equilibrium.
- Analyse why non-price competition is so common in oligopolistic markets.