The Trade Cycle
What Is the Trade Cycle?
Definition: The trade cycle is the fluctuation in real GDP over time, with periods of boom and recession.
Key Idea: Actual GDP rises and falls around the underlying long-term trend rate of growth, which represents the path of potential GDP or LRAS.
The Stages of the Trade Cycle
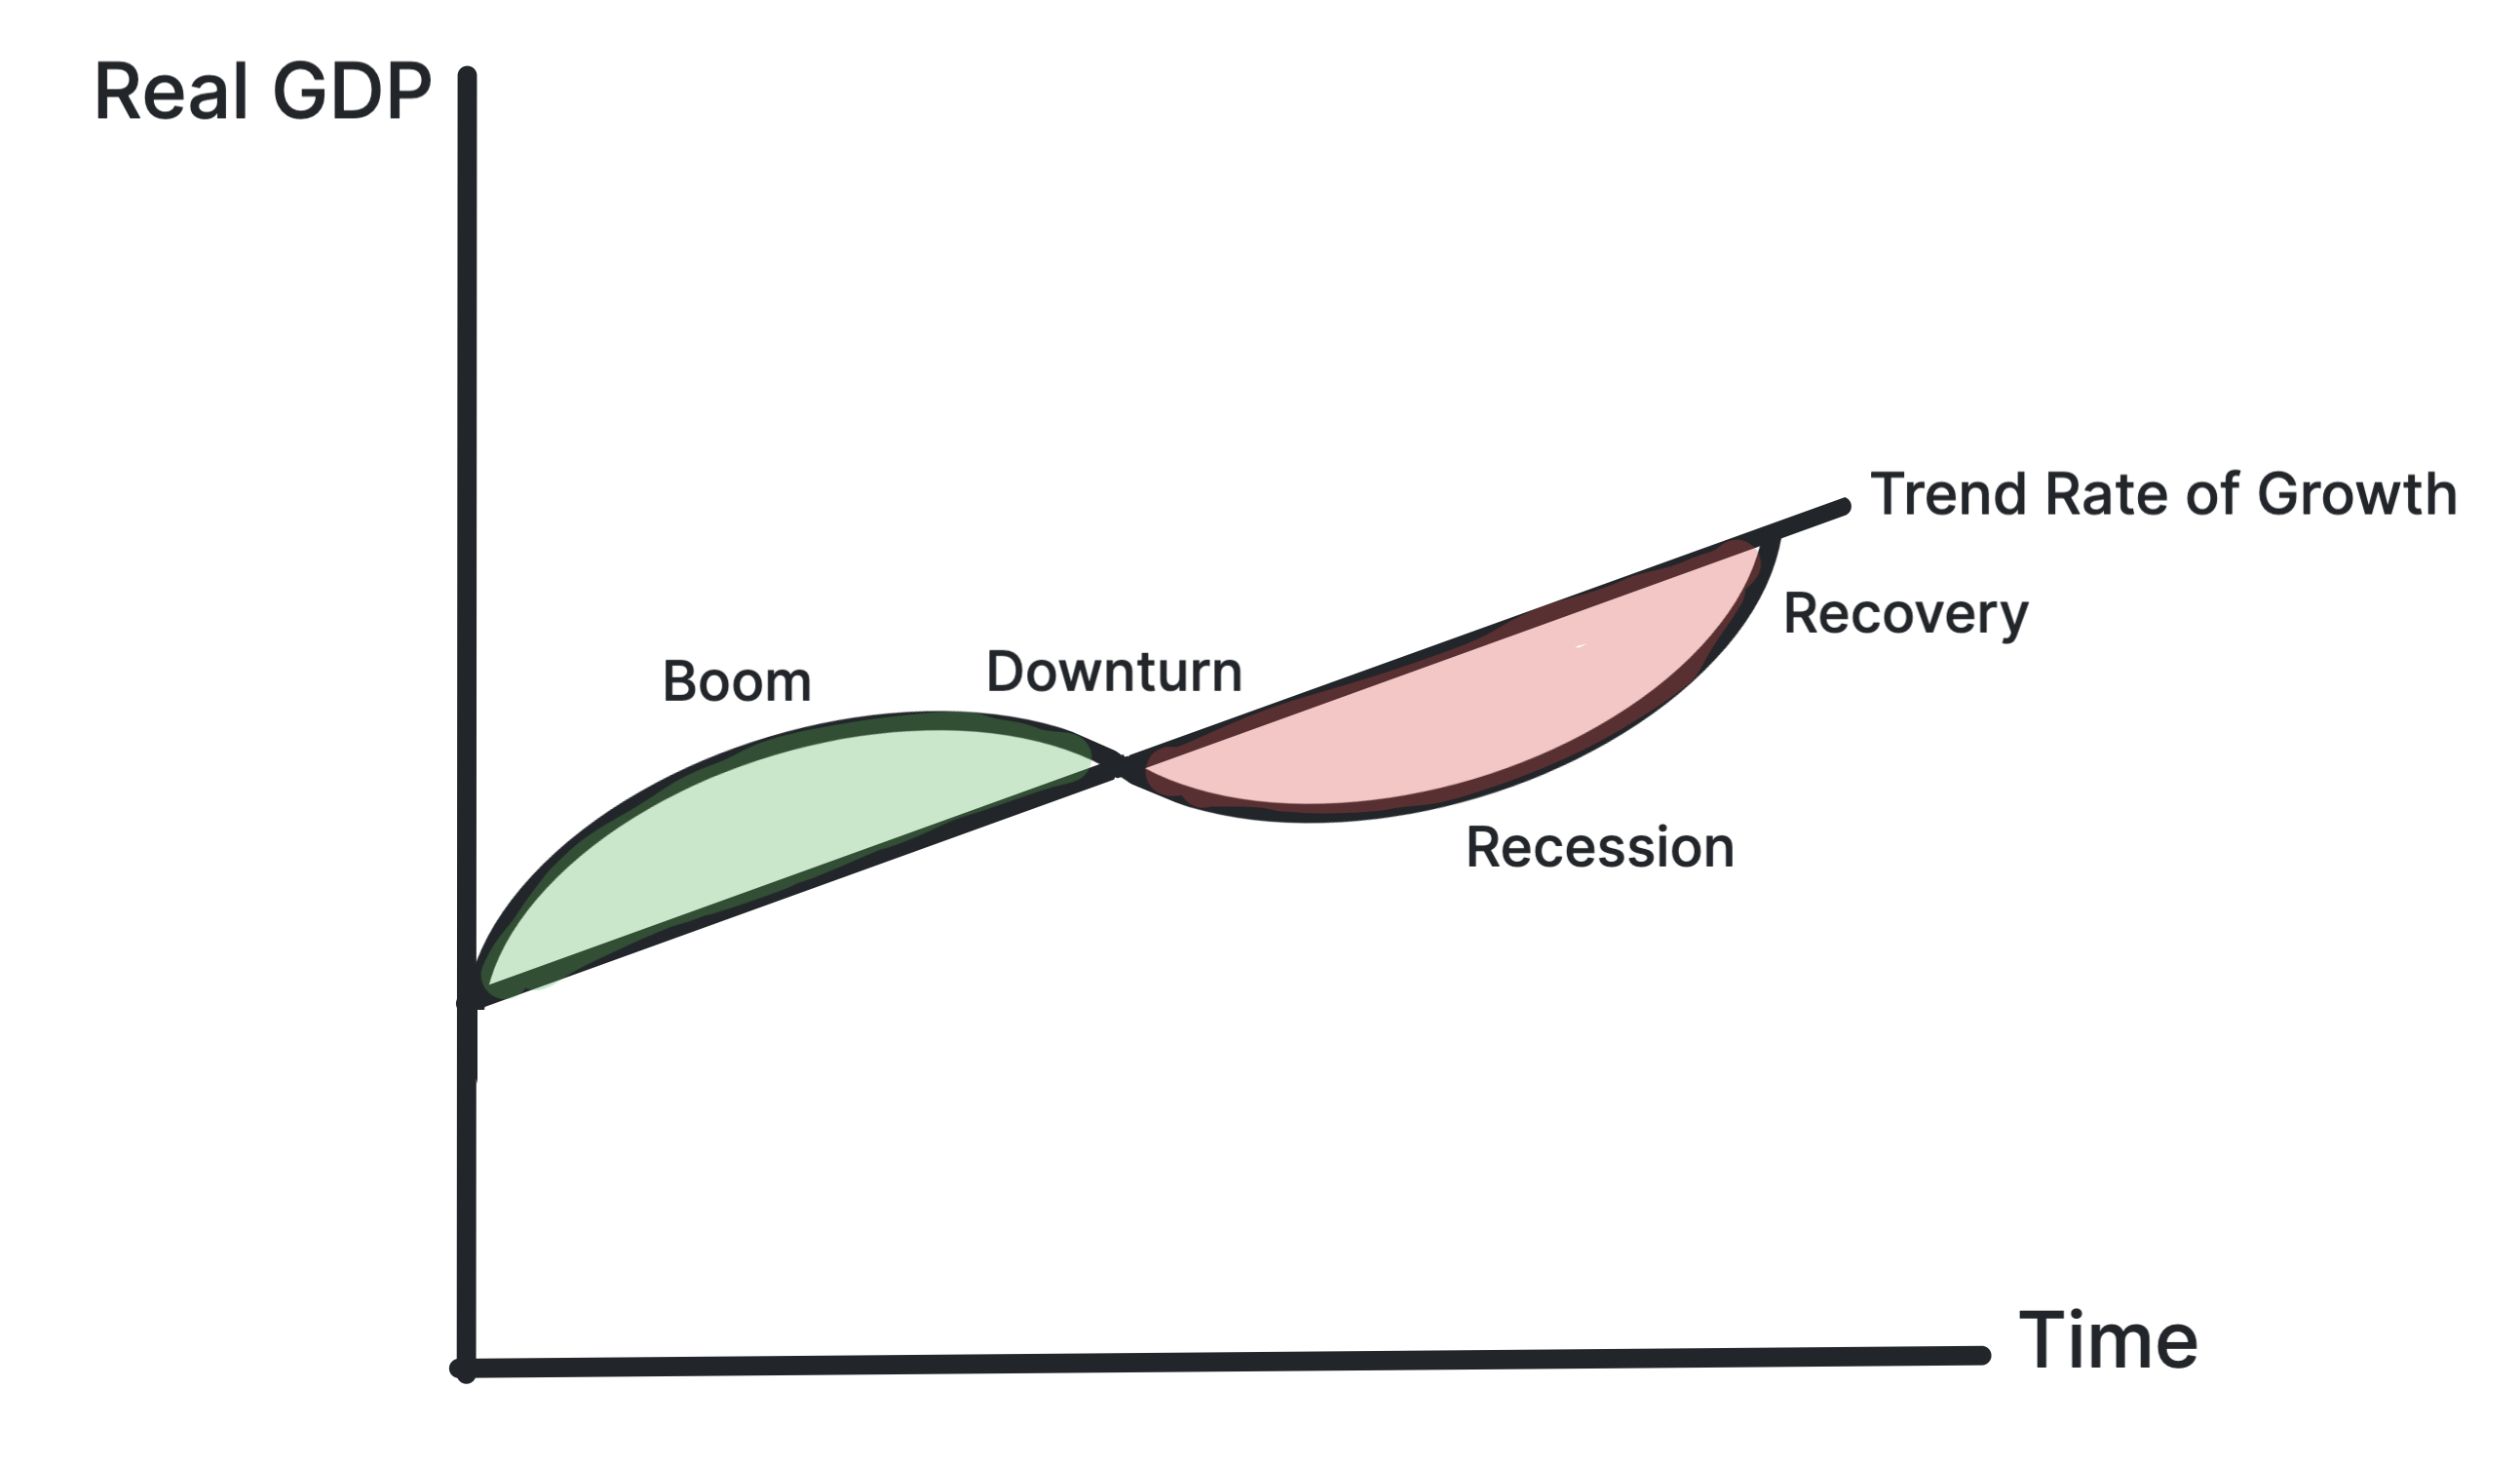
The cycle runs through four phases in sequence:
- Boom (peak): the top of the cycle, with actual GDP above the trend rate and a positive output gap.
- Recession (downturn): the downward slope, as growth slows and actual GDP falls back below the trend rate. A technical recession is two consecutive quarters of negative growth.
- Slump (trough): the bottom of the cycle, furthest below the trend rate, with the largest negative output gap.
- Recovery (expansion): the upward slope, as growth resumes and actual GDP moves back towards the trend rate.
Characteristics of Booms and Recessions
| Boom | Recession |
|---|---|
| High and rising real GDP | Falling real GDP |
| Low unemployment | Rising unemployment |
| High inflation (demand-pull) | Low or falling inflation |
| Positive output gap | Negative output gap |
| High consumer and business confidence | Low consumer and business confidence |
| High levels of investment | Low levels of investment |
| Rising government tax revenue | Falling government tax revenue |
Output Gaps and the Trade Cycle
- During a boom, the economy operates with a positive output gap, where actual output is above potential output. This is represented by the green area on the diagram.
- During a recession, the economy operates with a negative output gap, where actual output is below potential output. This is represented by the red area on the diagram.
- The trend line represents the path of potential output, while fluctuations around it reflect changes in aggregate demand.
Causes of the Trade Cycle
The trade cycle is caused by fluctuations in aggregate demand, which can be influenced by changes in:
- Consumer confidence and spending, which can be affected by factors such as interest rates, inflation, and employment prospects. When consumers are confident, they are more likely to spend, boosting aggregate demand and contributing to a boom. Conversely, when confidence is low, consumers may cut back on spending, leading to a recession.
- Business investment, which can be influenced by factors such as interest rates, expected returns, and economic outlook. High levels of investment can drive economic growth and contribute to a boom, while low levels of investment can lead to a slowdown and recession.
The Role of Government
Governments and central banks try to smooth the cycle and reduce the severity of booms and recessions through demand-side stabilisation policy.
During a boom: They may use contractionary policies such as higher interest rates, higher taxes, or lower government spending to cool aggregate demand and control inflation.
During a recession: They may use expansionary policies such as lower interest rates, lower taxes, or higher government spending to boost aggregate demand, close the negative output gap, and reduce unemployment.
Stuck on this topic? Work through it with an online A-Level Economics tutor in a free 15-minute intro call, or send an essay on it for A-Level Economics essay marking.