Aggregate Demand
What Is Aggregate Demand?
Definition: Aggregate demand is the total demand for all goods and services in an economy at a given average price level and in a given time period.
Formula (Expenditure Approach):
\[ AD = C + I + G + (X - M) \]
C = Consumption: Spending by consumers/households on goods and services.
I = Investment: Spending by firms on capital goods e.g. machinery, equipment, and factories.
G = Government Spending: Spending on state-provided goods and services. This excludes transfer payments such as benefits.
(X - M) = Net Exports: Exports minus imports.
The Components of AD and Their Relative Importance
- Consumption (C): Around 60% of AD. This is the largest component and is influenced by factors such as consumer confidence, disposable income, and interest rates.
- Investment (I): Around 14% of AD. This is the most volatile component and is influenced by business confidence, interest rates, and expectations of future economic conditions.
- Government Spending (G): Around 25% of AD. This is determined by government fiscal policy and can be influenced by political priorities and the state of the economy (e.g., during a recession, government spending may increase to stimulate demand).
- Net Exports (X - M): Usually a small and often negative percentage, roughly 1% or less. This is influenced by exchange rates, income levels in trading partner countries, and trade policies.
Implications: Because consumption is the largest component of AD, changes in consumer confidence, disposable income, and interest rates can have a more significant impact on aggregate demand than changes in investment or net exports.
Worked Example: Calculating Aggregate Demand
An economy records the following expenditure over a year:
| Consumption (C) | £1,200bn |
| Investment (I) | £280bn |
| Government spending (G) | £500bn |
| Exports (X) | £640bn |
| Imports (M) | £660bn |
| Aggregate demand | 1,200 + 280 + 500 + (640 − 660) = £1,960bn |
Net trade is negative here, at −£20bn, because imports exceed exports - so it is subtracted from the other three components rather than added. The resulting shares bear out the proportions given above: consumption 61%, investment 14%, government spending 26% and net trade −1%.
The Aggregate Demand Curve
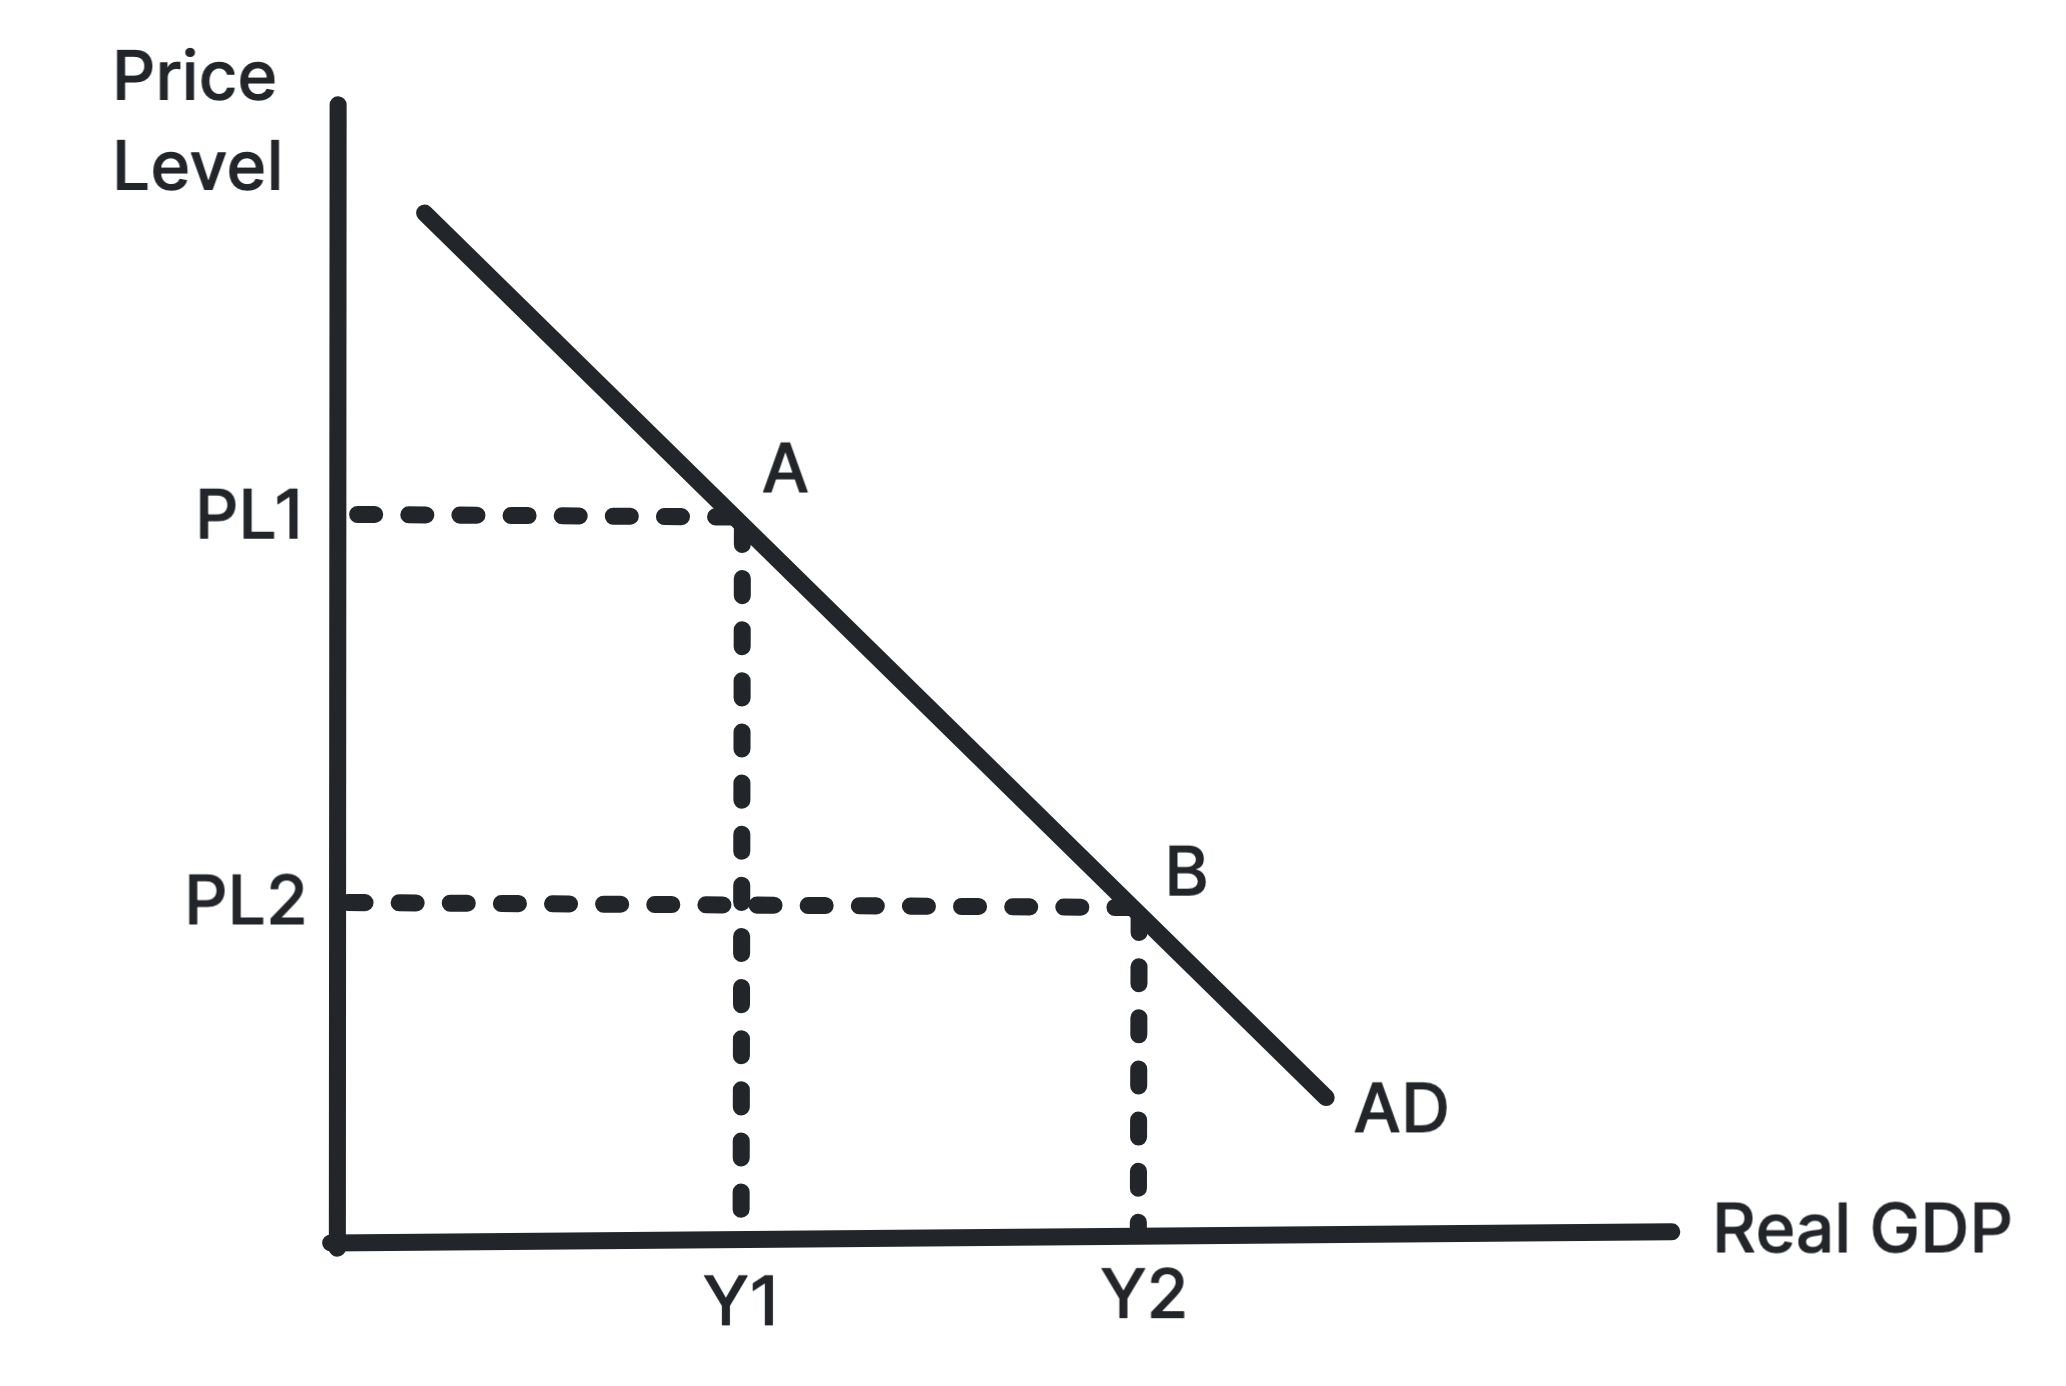
Why the AD Curve Slopes Downward
- Wealth Effect: As the price level falls, the real value of money increases, making consumers feel wealthier and more likely to spend, increasing consumption (C).
- Interest Rate Effect: A lower price level reduces the demand for money, leading to lower interest rates, which encourages borrowing and investment (I) and increases consumption (C).
- International Trade Effect: A lower domestic price level makes exports cheaper and imports more expensive, increasing net exports (X - M).
Movements vs. Shifts of the AD Curve
A Movement Along the AD Curve
- Cause: A change in the average price level, assuming other factors stay constant.
- This shows how the quantity of real GDP demanded changes with the price level.
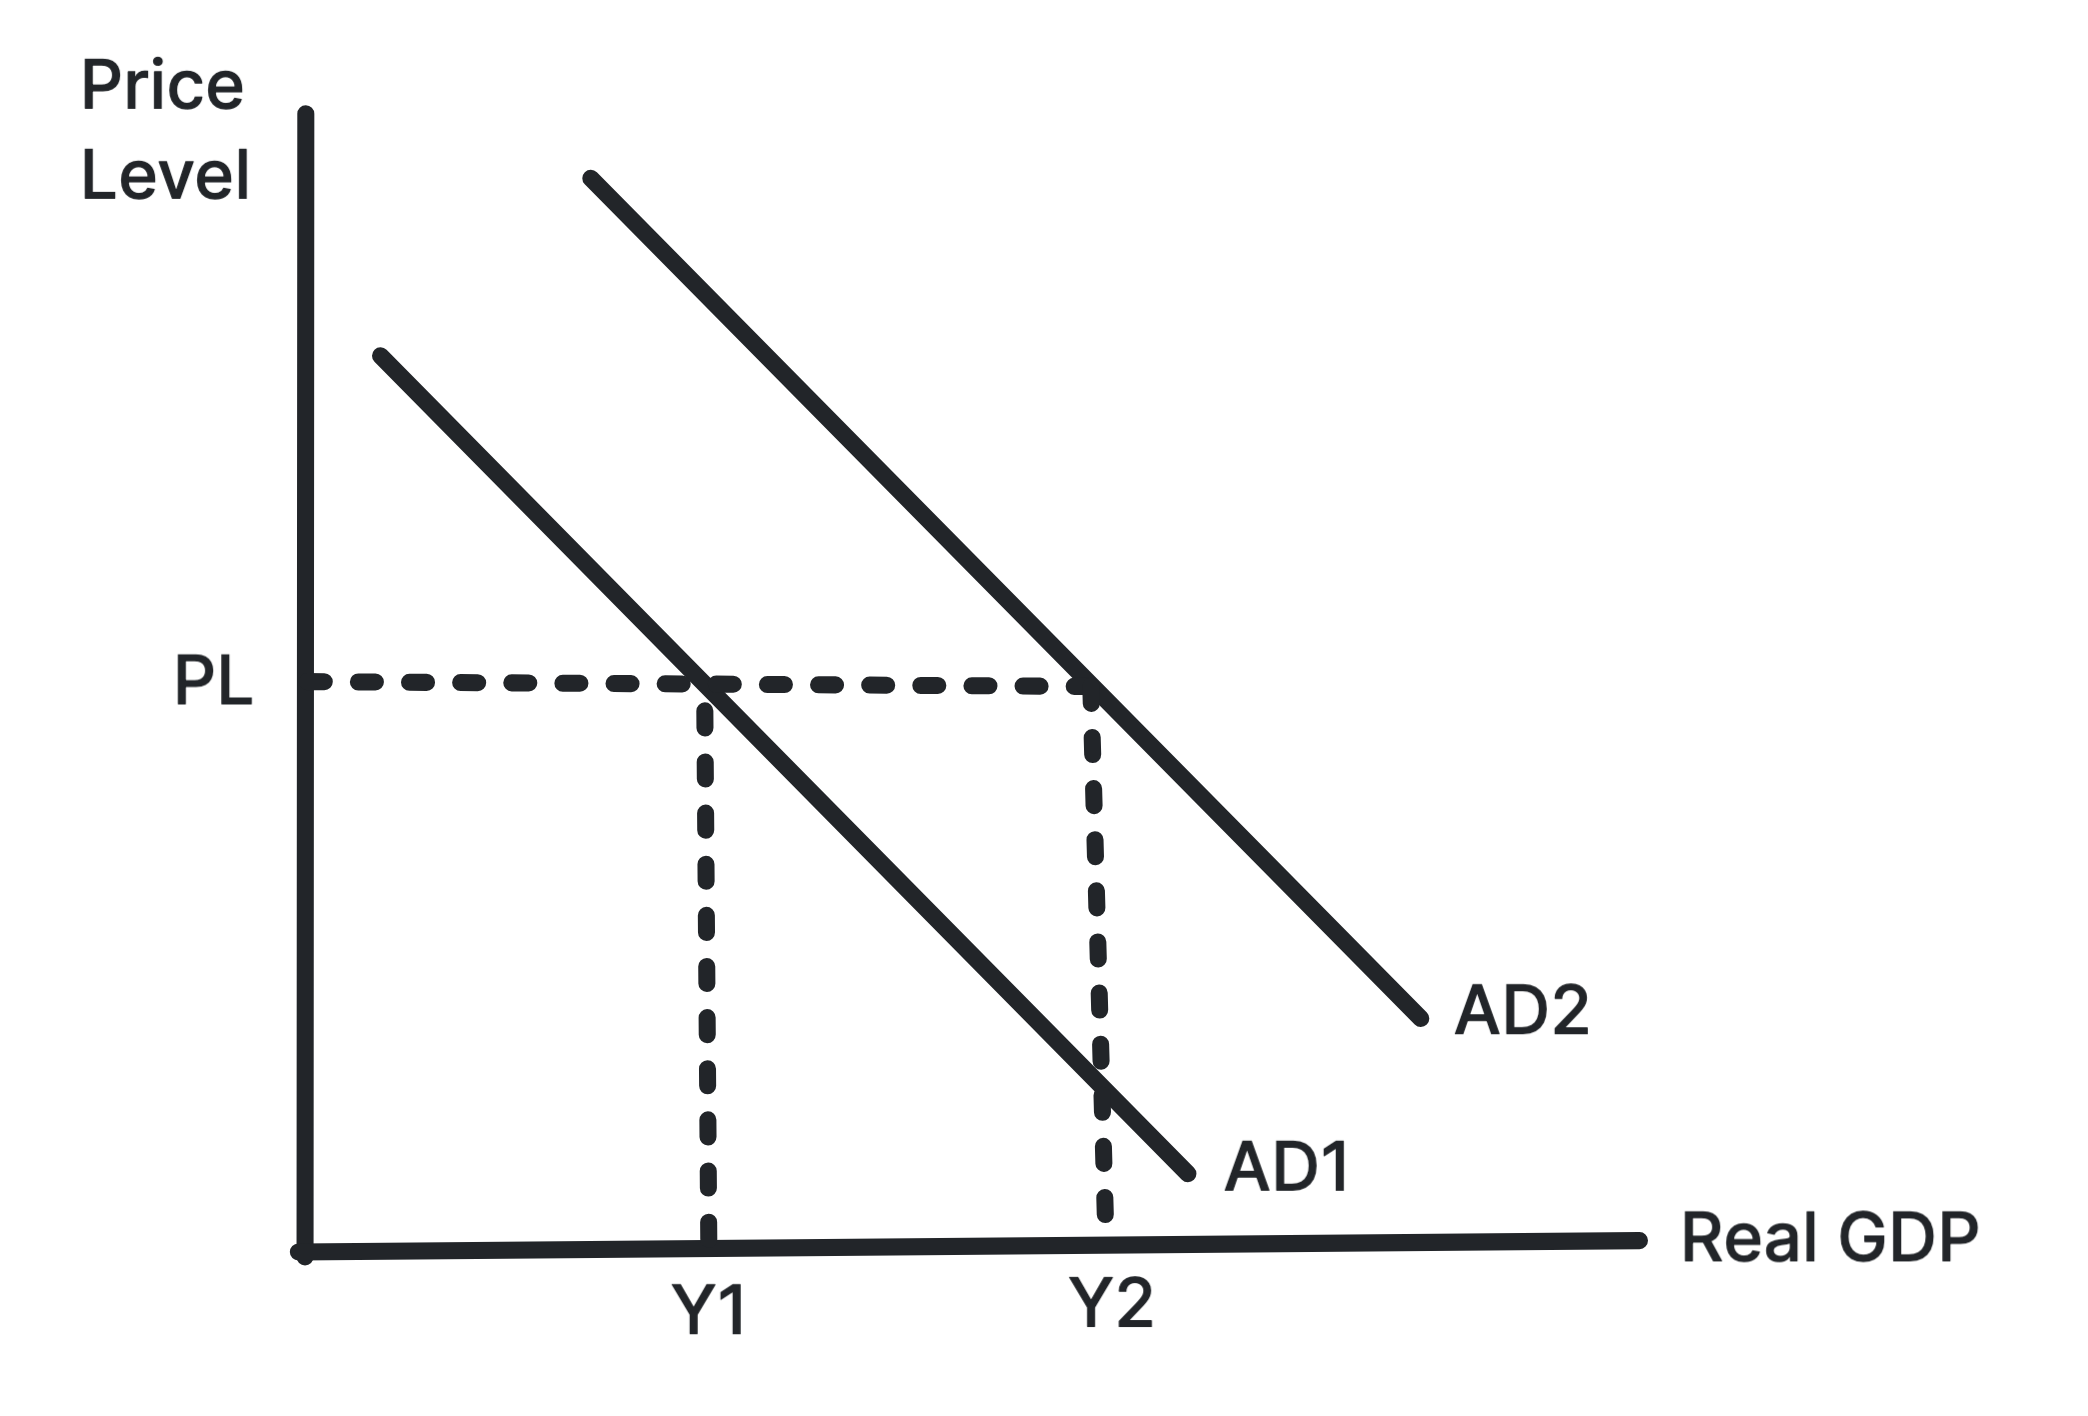
A Shift of the Entire AD Curve
- Cause: A change in any determinant of AD other than the price level, meaning a change in C, I, G, or X - M.
- This changes total planned expenditure at every given price level.
Determinants of AD
| Component | Affected by |
|---|---|
| Consumption (C) |
|
| Investment (I) |
|
| Government Spending (G) |
|
| Net Exports (X - M) |
|
Stuck on this topic? Work through it with an online A-Level Economics tutor in a free 15-minute intro call, or send an essay on it for A-Level Economics essay marking.