Inflation
Definitions: Inflation, Deflation, Disinflation
Inflation: A sustained increase in the general/average price level of goods and services in an economy.
Deflation: A sustained decrease in the general/average price level, giving a negative inflation rate.
Disinflation: A decrease in the rate of inflation. Prices are still rising, but at a slower pace.
Measuring Inflation: The Consumer Price Index (CPI)
- CPI is the UK's official measure. The Bank of England has an inflation target of CPI 2%.
How It's Calculated
Basket of Goods: A representative basket of around 700 goods and services that an average household buys is created and updated annually.
Weighting: Items are weighted according to their proportion of household spending. For example, energy (heating, electricity, gas) has a greater weight than clothing.
Price Collection: Prices are collected monthly from numerous locations.
CPI Calculated: The Price of the basket in the current year is then calculated by multiplying the price of each item by its weighting, and summing these values. This is the price level for the current year. The CPI is then calculated by comparing the price level of the current year to that of a base year, which is set to 100.
Index Calculation:
\[ \text{CPI} = \frac{\text{Price of basket in current year}} {\text{Price of basket in base year}} \times 100 \]
\[ \text{Inflation Rate} = \frac{\text{CPI Year2 - CPI Year1}} {\text{CPI Year1}} \times 100 \]
Worked Example: From Basket Cost to Inflation Rate
The cost of a representative basket of goods is recorded for three years, with 2023 as the base year:
| Year | Cost of basket | CPI (2023 = 100) |
|---|---|---|
| 2023 (base) | £480.00 | \( \frac{480}{480} \times 100 = 100 \) |
| 2024 | £504.00 | \( \frac{504}{480} \times 100 = 105 \) |
| 2025 | £524.16 | \( \frac{524.16}{480} \times 100 = 109.2 \) |
| Inflation in 2024 | \( \frac{105 - 100}{100} \times 100 = 5\% \) |
| Inflation in 2025 | \( \frac{109.2 - 105}{105} \times 100 = 4\% \) |
The inflation rate fell from 5% to 4%, yet the basket still costs more in 2025 than in 2024. A falling inflation rate means prices are rising more slowly, not falling. Note too that the 2025 rate is measured against the 2024 index of 105, not against the base year.
Limitations of the CPI
Not Representative: The average basket may not reflect the spending patterns of different households, such as pensioners and students.
Regional Variations: CPI ignores differences in price changes across the country.
Quality Changes: It does not fully account for improvements in product quality over time.
Substitution Bias: It can be slow to reflect when consumers switch to cheaper alternatives.
Data Collection Errors: It is based on a sample survey, which can be inaccurate.
Retail Price Index (RPI)
- RPI is an alternative measure that includes housing costs, such as mortgage interest and council tax.
- It generally yields a higher inflation rate than CPI.
- It is considered less reliable for international comparisons and is not the UK's official target measure.
Causes of Inflation
Demand-Pull Inflation
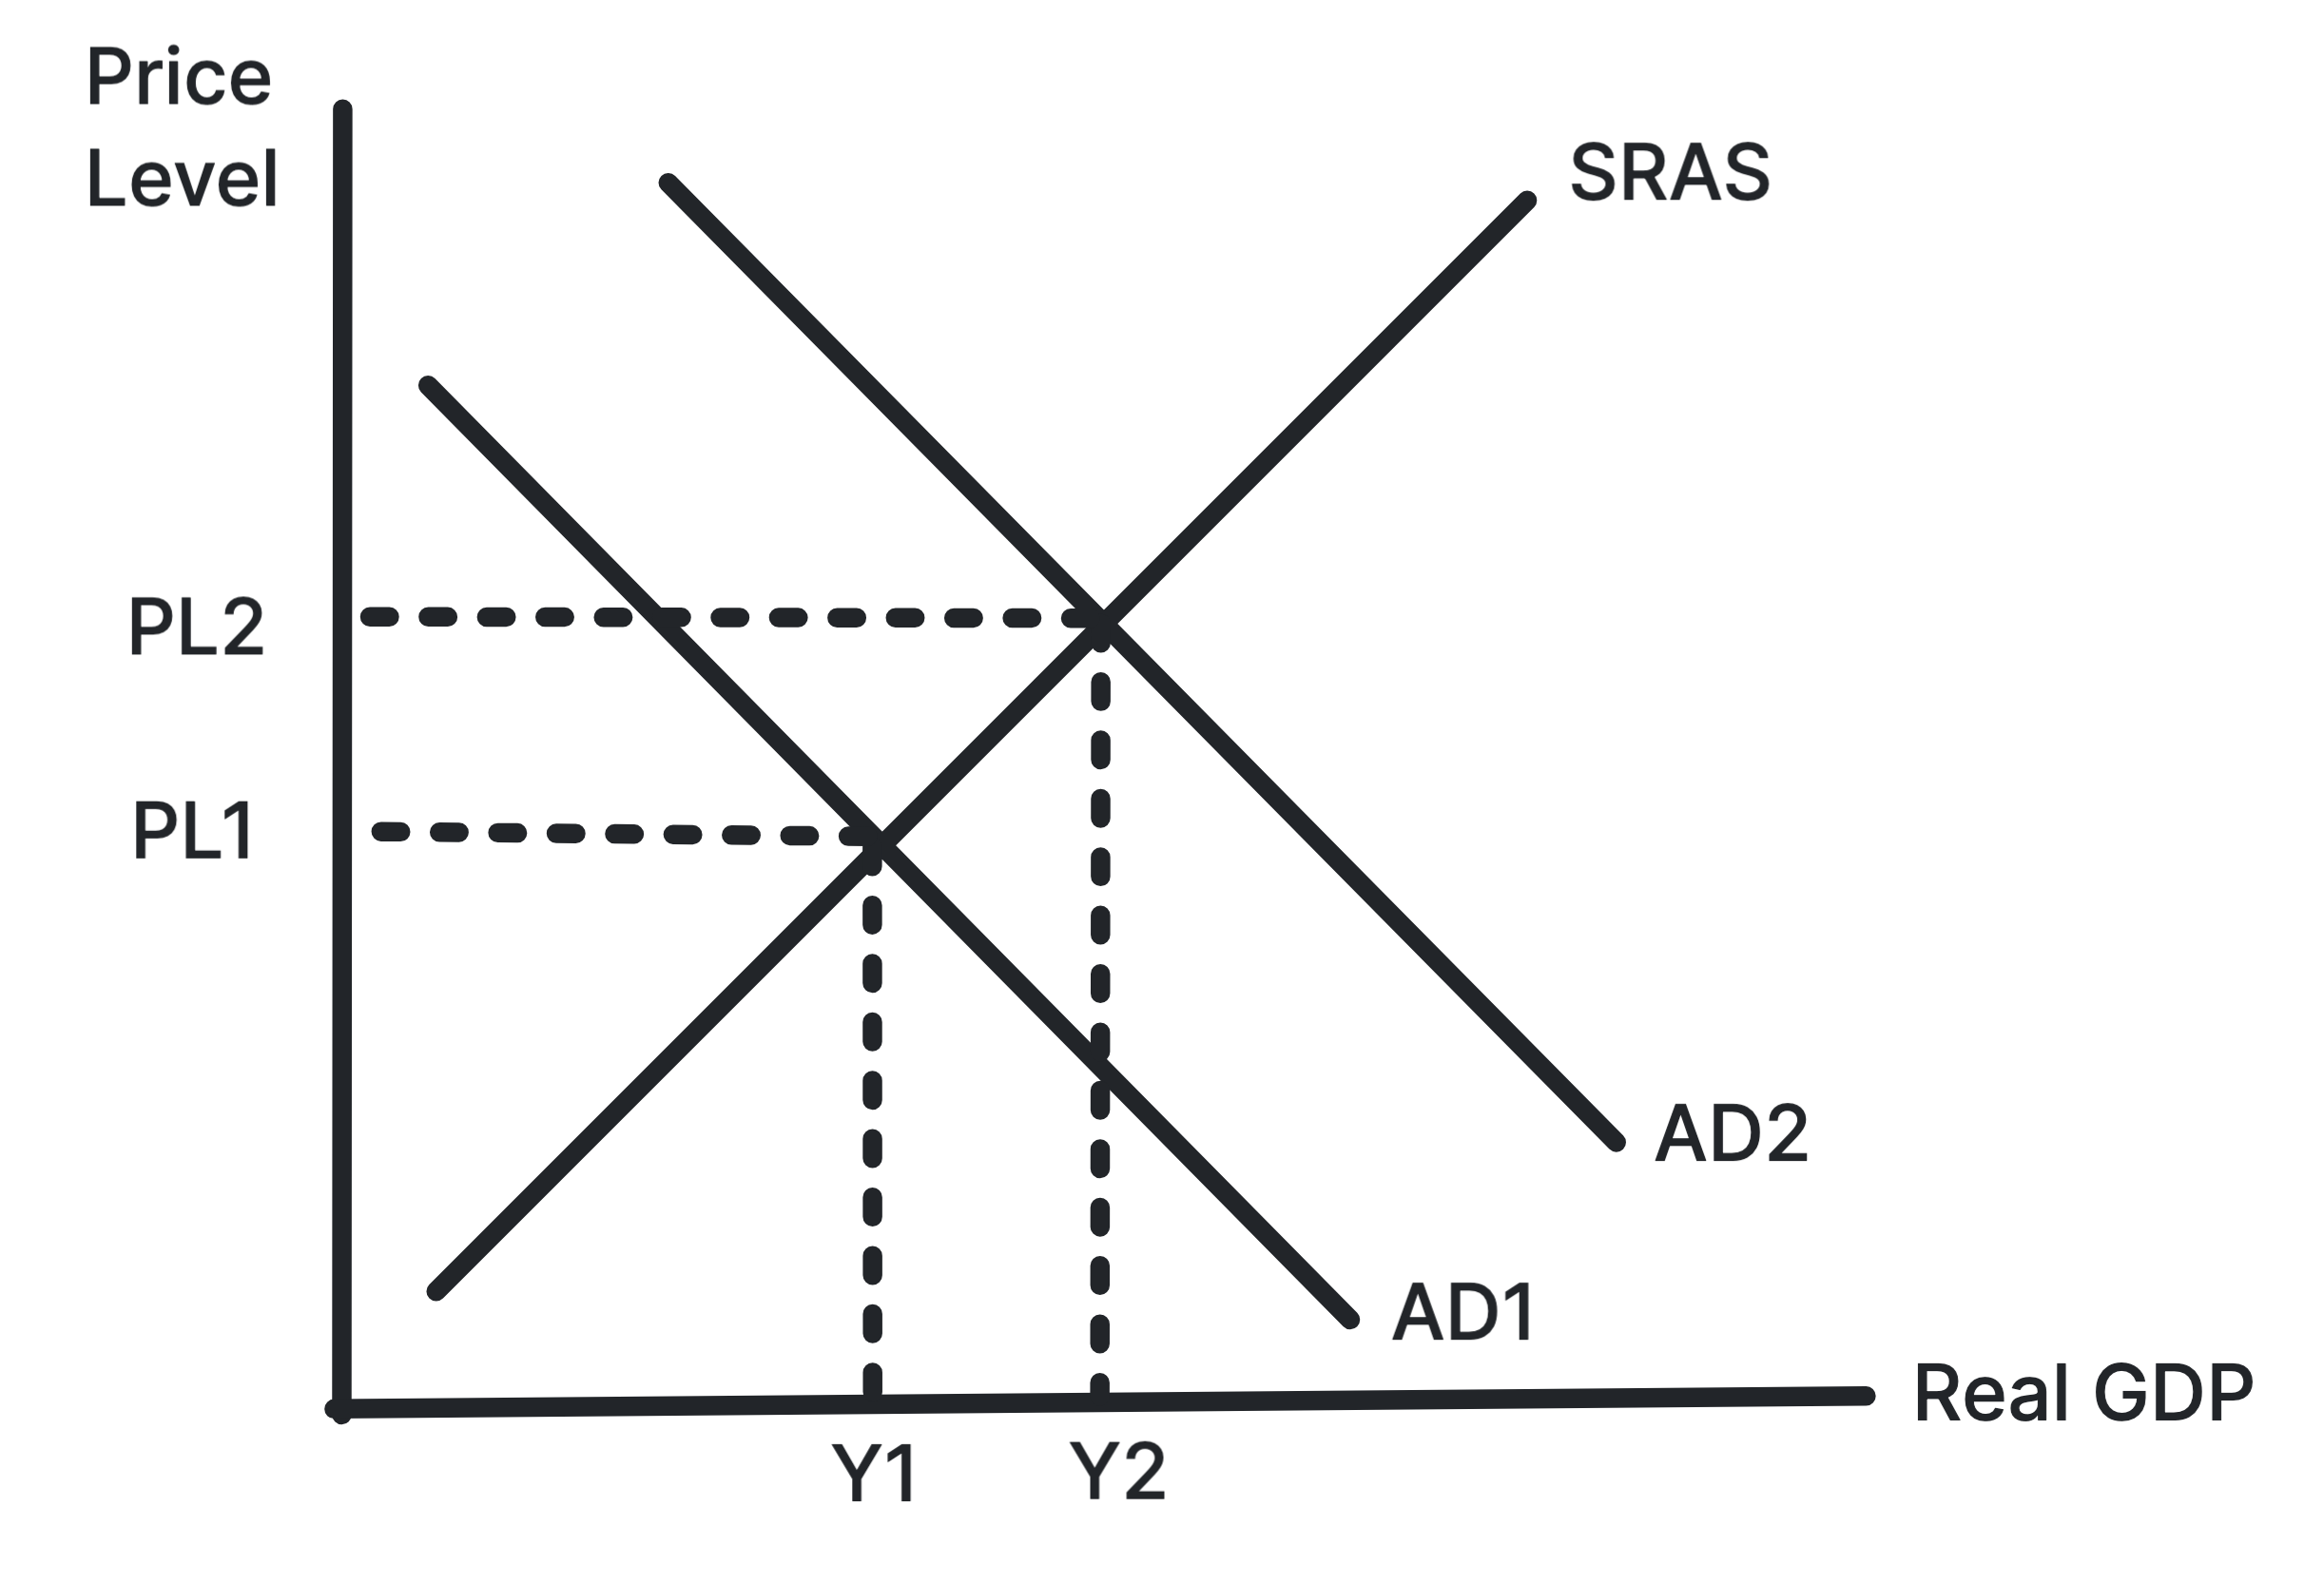
Demand-pull inflation: occurs when there is an increase in aggregate demand (AD), leading to upward pressure on prices.
Causes: Higher consumer confidence, higher government spending, lower taxes, lower interest rates, and stronger export demand etc. Anything that increases Consumption (C), Investment (I), Government Spending (G) or Net Exports (X-M) can cause demand-pull inflation.
Cost-Push Inflation
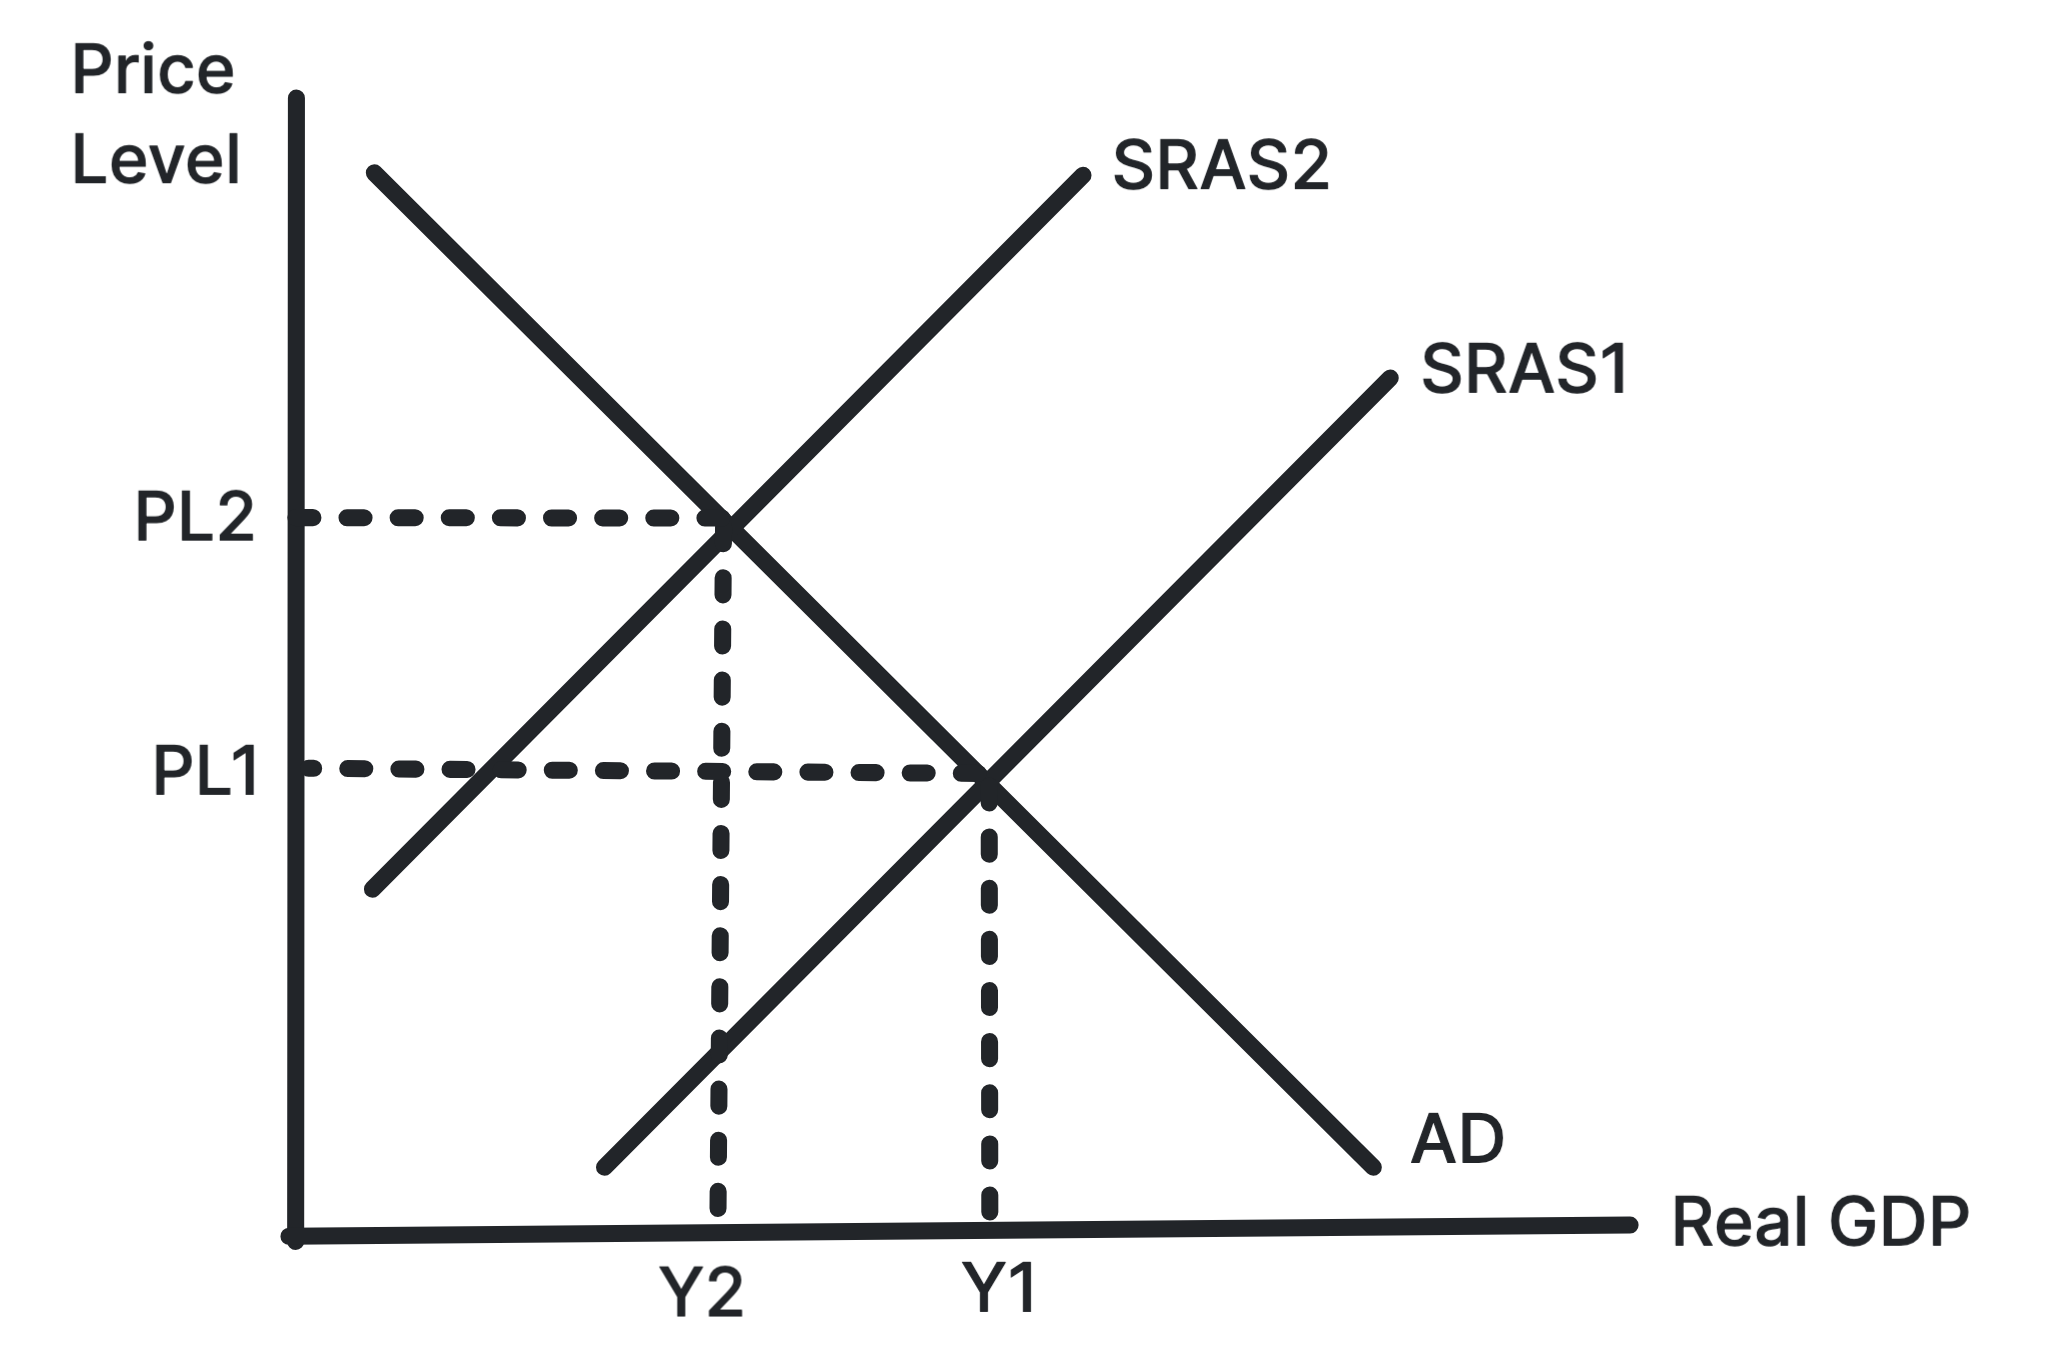
Cost-push inflation: Occurs when there is rise in the costs of production for firms, shifting the SRAS curve leftwards.
Causes: Higher global commodity prices, higher wages, higher indirect taxes, supply chain shocks, and a depreciation of the currency which increases import costs.
Growth of the Money Supply
Excessive growth in the money supply, such as through quantitative easing, can fuel demand-pull inflation and cost-push inflation.
- A large increase in the money supply can lead to higher consumer spending and demand-pull inflation as it results in lower interest rates at commercial banks and increased borrowing.
- An increase in the money supply can lead to higher production costs and cost-push inflation. For example, it can lead to a depreciation of the currency, which increases the cost of imported raw materials and components for firms.
- An increase in the money supply can lead to higher asset prices, which can increase the cost of capital for firms and lead to cost-push inflation.
Wage-Price Spiral
A vicious cycle where rising prices in the economy lead to higher wage demands from workers, which in turn increases firms' costs and leads to further price increases, which cause workers to demand even higher wages. This can sustain inflation even if the initial cause has been resolved.
Effects of Inflation
| Stakeholder | Potential Negative Effects |
|---|---|
| Consumers |
|
| Firms |
|
| Government/Economy |
|
| Workers |
|
Stuck on this topic? Work through it with an online A-Level Economics tutor in a free 15-minute intro call, or send an essay on it for A-Level Economics essay marking.