Government Intervention in Markets
These Edexcel A-Level Economics revision notes cover unit 1.4.1, surveying the tools governments use to correct market failure — including indirect taxes, subsidies, maximum and minimum prices, regulations, and information provision — with analysis of each policy's effectiveness.
Reasons for Government Intervention
Governments intervene in mixed economies to:
- Correct market failure: achieve a more socially efficient allocation of resources, for example by addressing externalities.
- Earn government revenue: fund public services through taxes or the sale of licences.
- Promote equity: reduce inequality and support poorer households.
- Support firms: help key industries remain competitive globally.
Indirect Taxation
Purpose: to reduce consumption and production of demerit goods, such as tobacco or alcohol, and to generate government revenue.
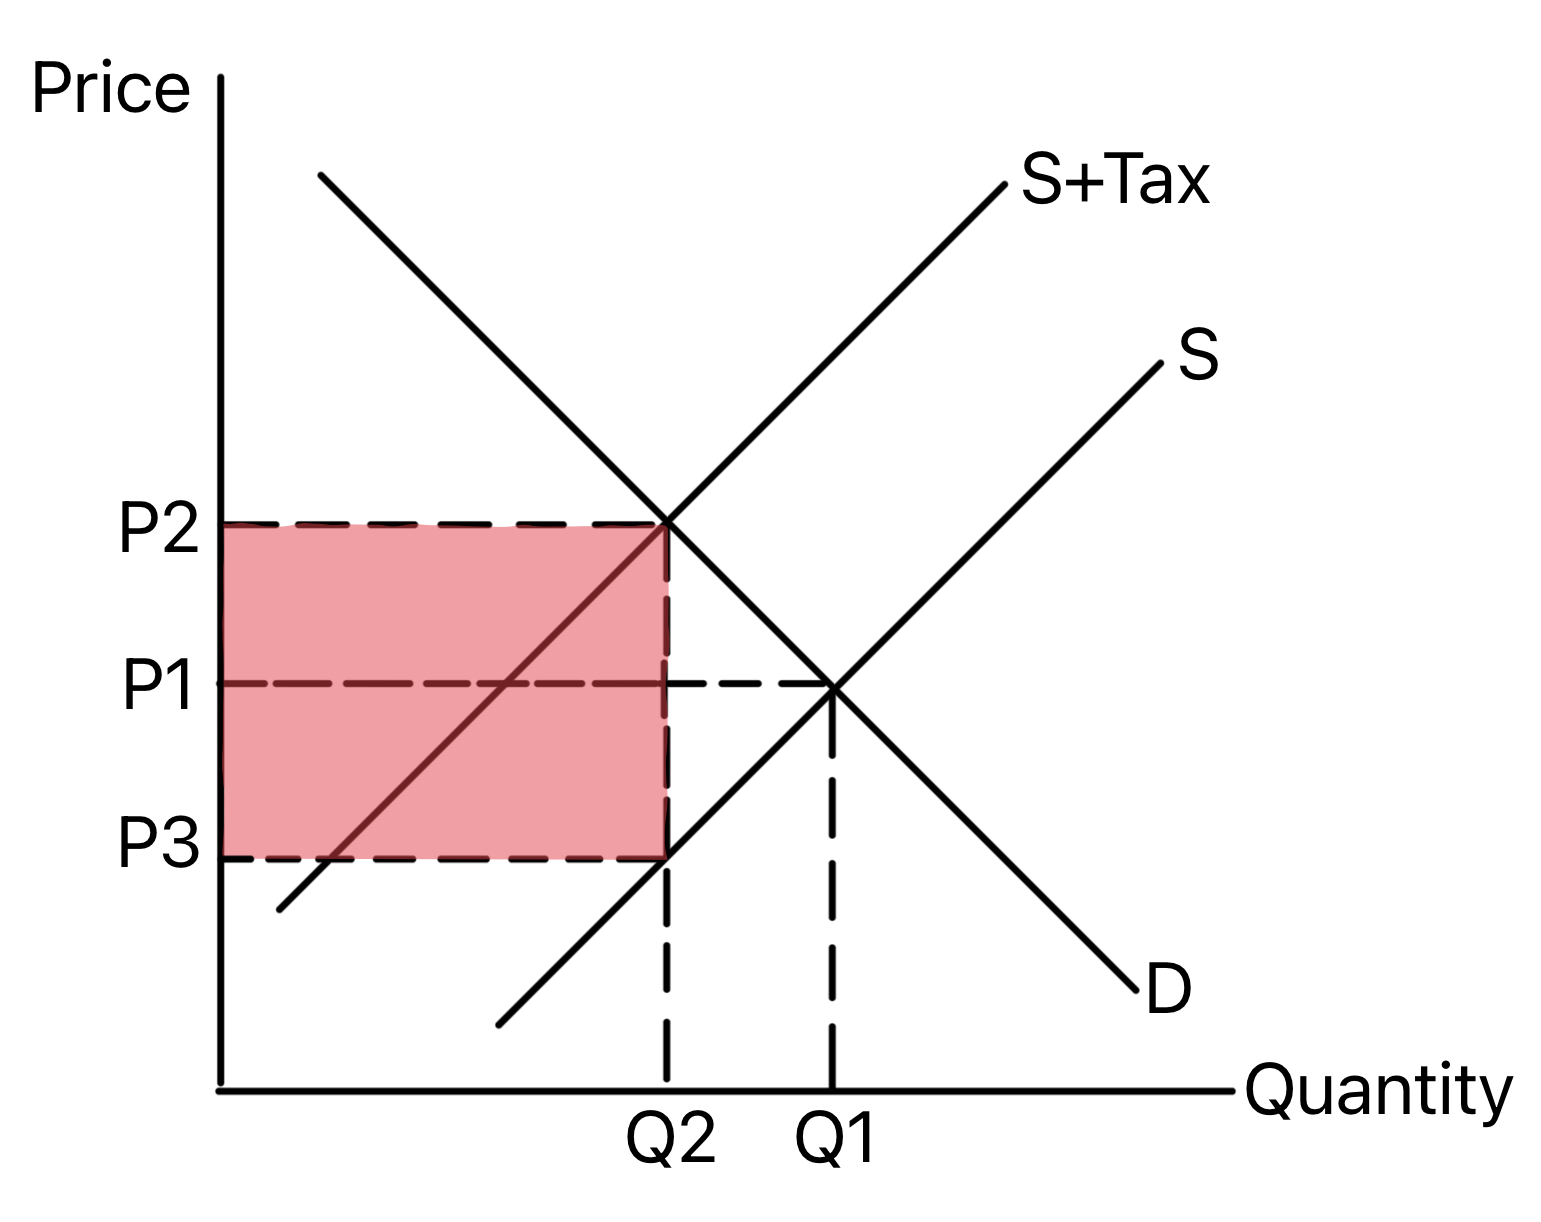
Effect: an indirect tax increases costs for producers, shifting the S=MPC curve to the left. This internalises negative externalities and leads to a higher price being paid by consumers and reduces the quantity demanded and supplied in the market.
-
Evaluations:
- PED: the effectiveness of an indirect tax depends on the price elasticity of demand (PED) for the good. If demand is inelastic, the tax will generate significant revenue but may not substantially reduce consumption. If demand is elastic, the tax may lead to a large reduction in consumption but generate less revenue.
- Regressive: indirect taxes are often regressive, meaning they take a larger proportion of income from lower-income households than from higher-income households. This can exacerbate inequality and may require compensatory measures, such as targeted subsidies or social welfare programs, to mitigate the impact on vulnerable groups.
Types of Indirect Tax
- Specific tax: a fixed amount per unit, causing a parallel shift of the supply curve.
- Ad valorem tax: a percentage of price, causing the supply curve to pivot upward and diverge from the original.
Subsidies
Purpose: to increase consumption and production of merit goods, encourage positive externalities, and support producers.
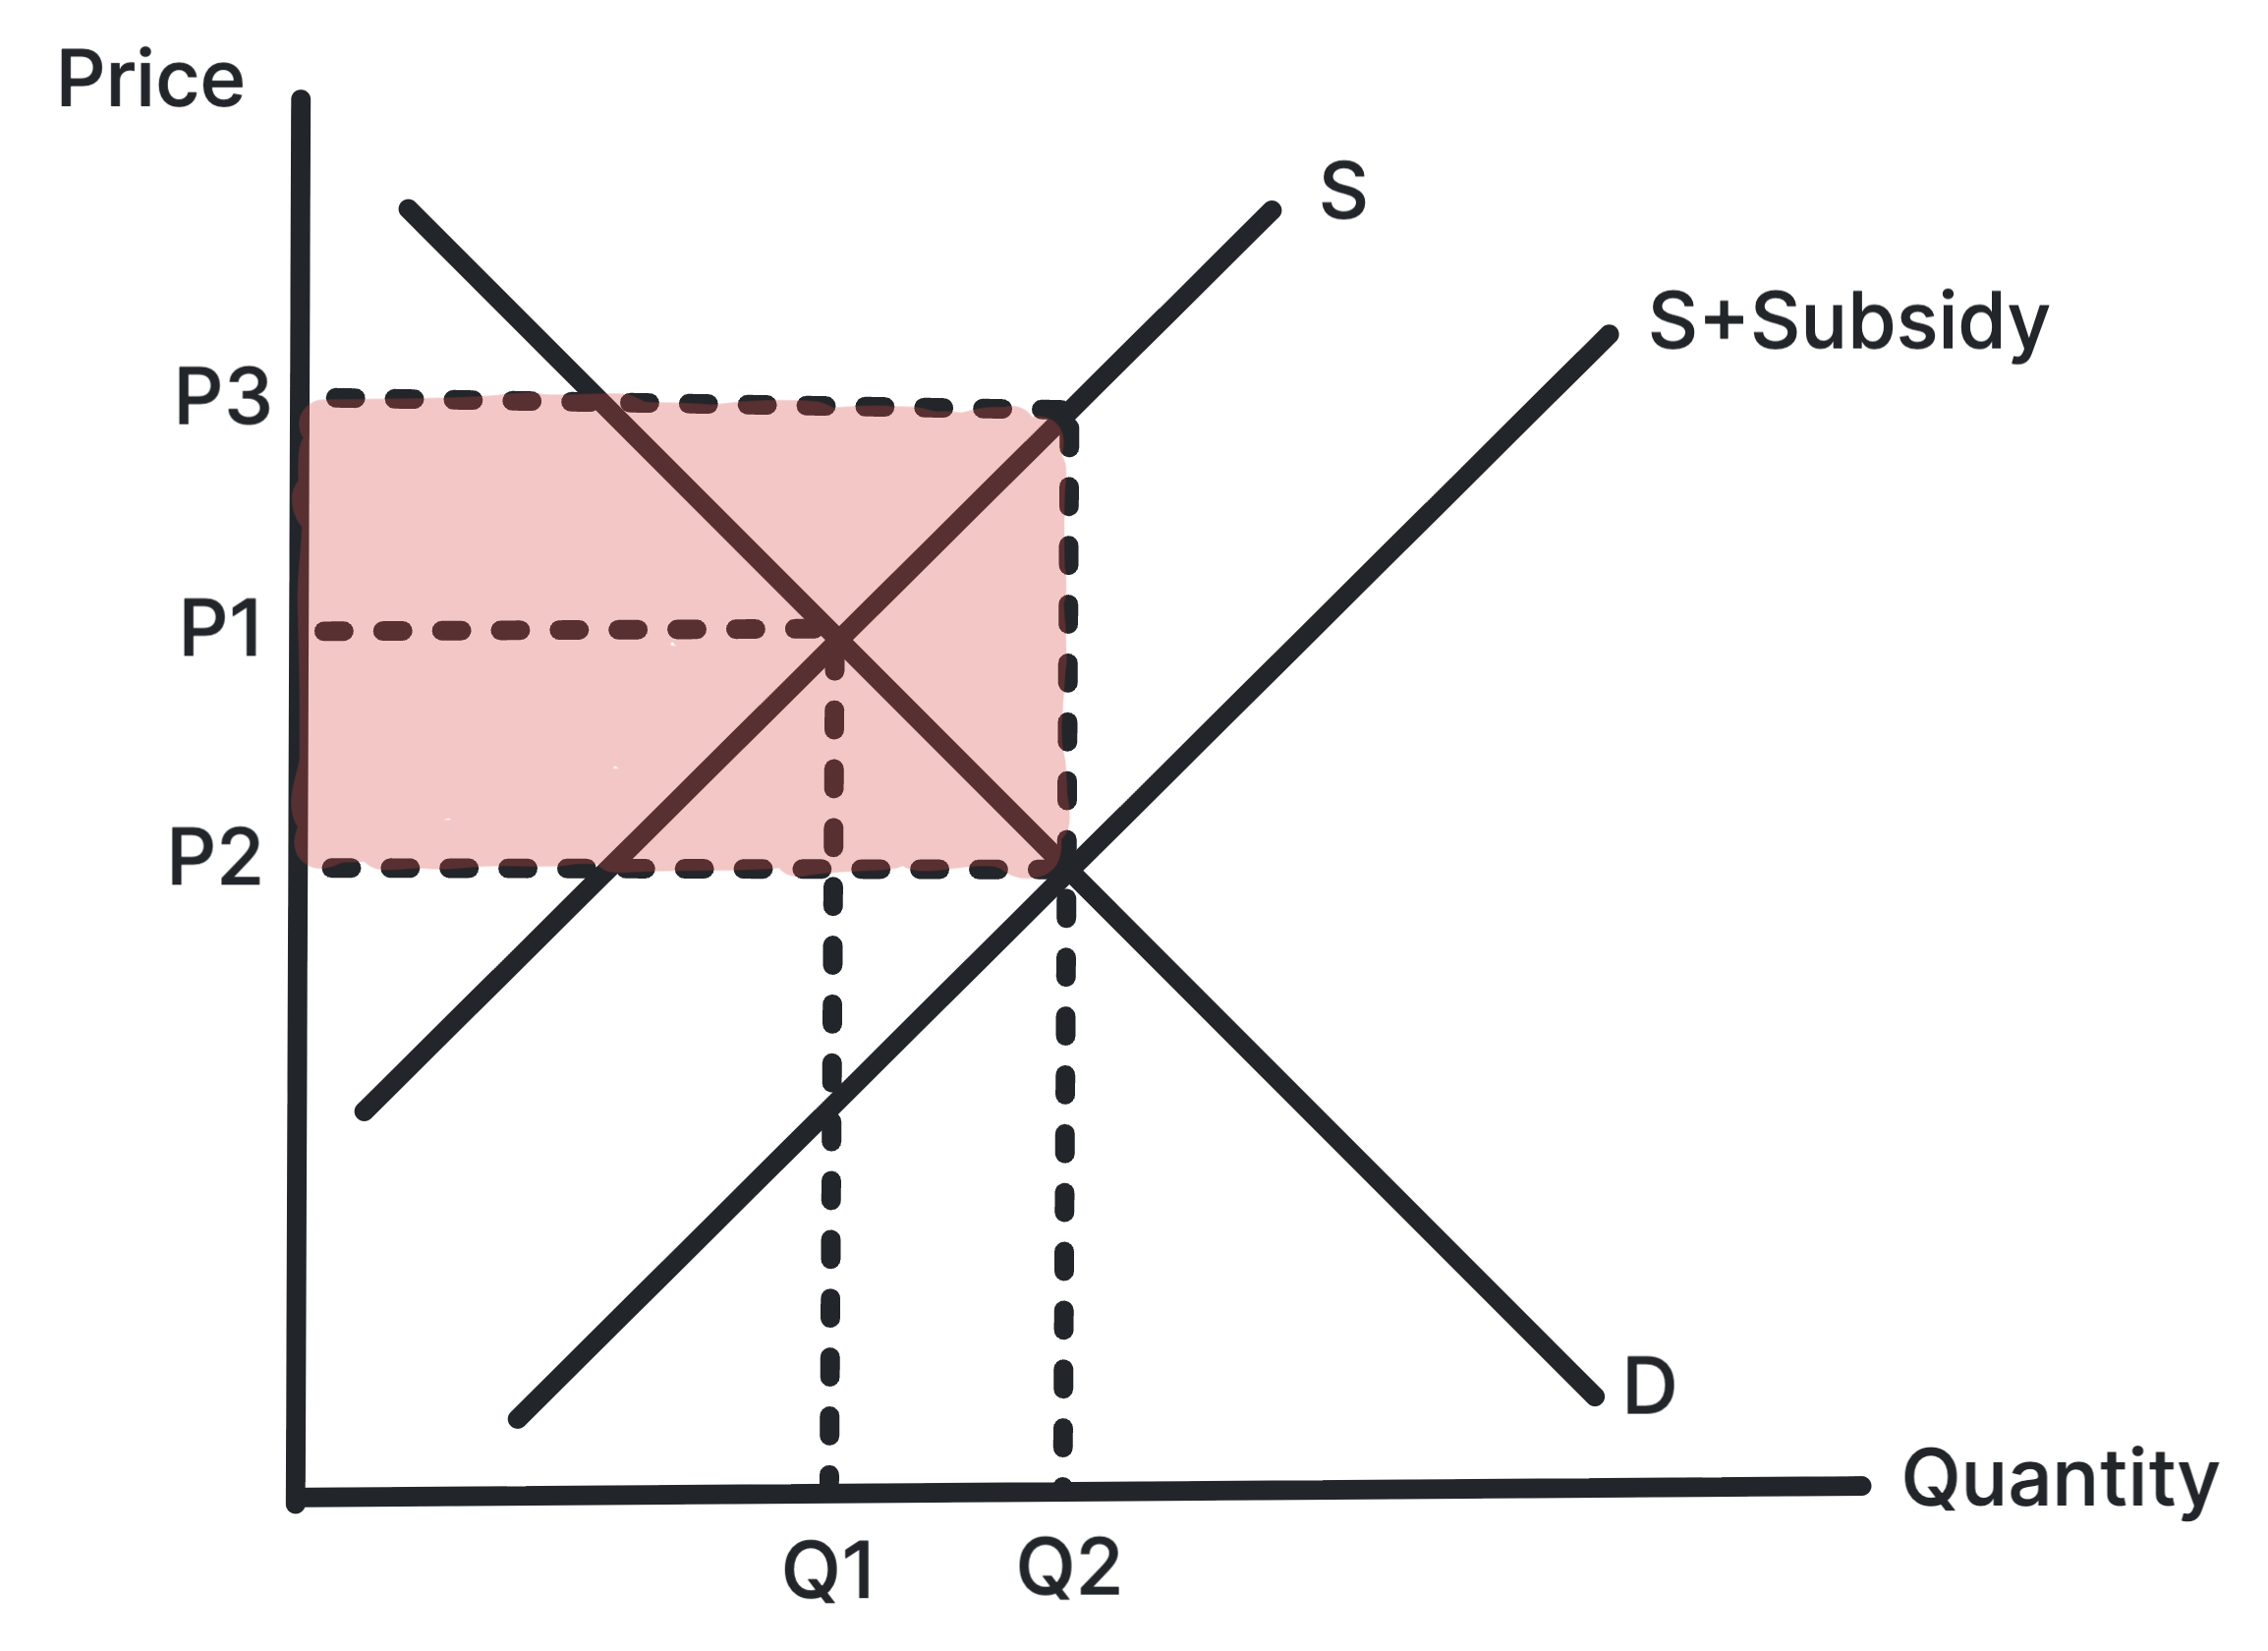
Effect: a subsidy lowers costs for producers, shifting the S=MPC curve to the right. This internalises positive externalities and leads to a lower price being paid by consumers and increases the quantity demanded and supplied in the market.
-
Evaluations:
- Inefficiency: businesses may become reliant on subsidies, reducing their incentive to innovate or improve efficiency. This can lead to a misallocation of resources and potentially create market distortions, where subsidised industries may not be the most productive or beneficial for society.
- Opportunity cost: subsidies require government spending, which has an opportunity cost. The funds used for subsidies could have been allocated to other public services or investments, and there is a risk of misallocation of resources if subsidies are not targeted effectively.
Maximum Prices
Purpose: to make essential goods and services, such as food or rent, more affordable for consumers.
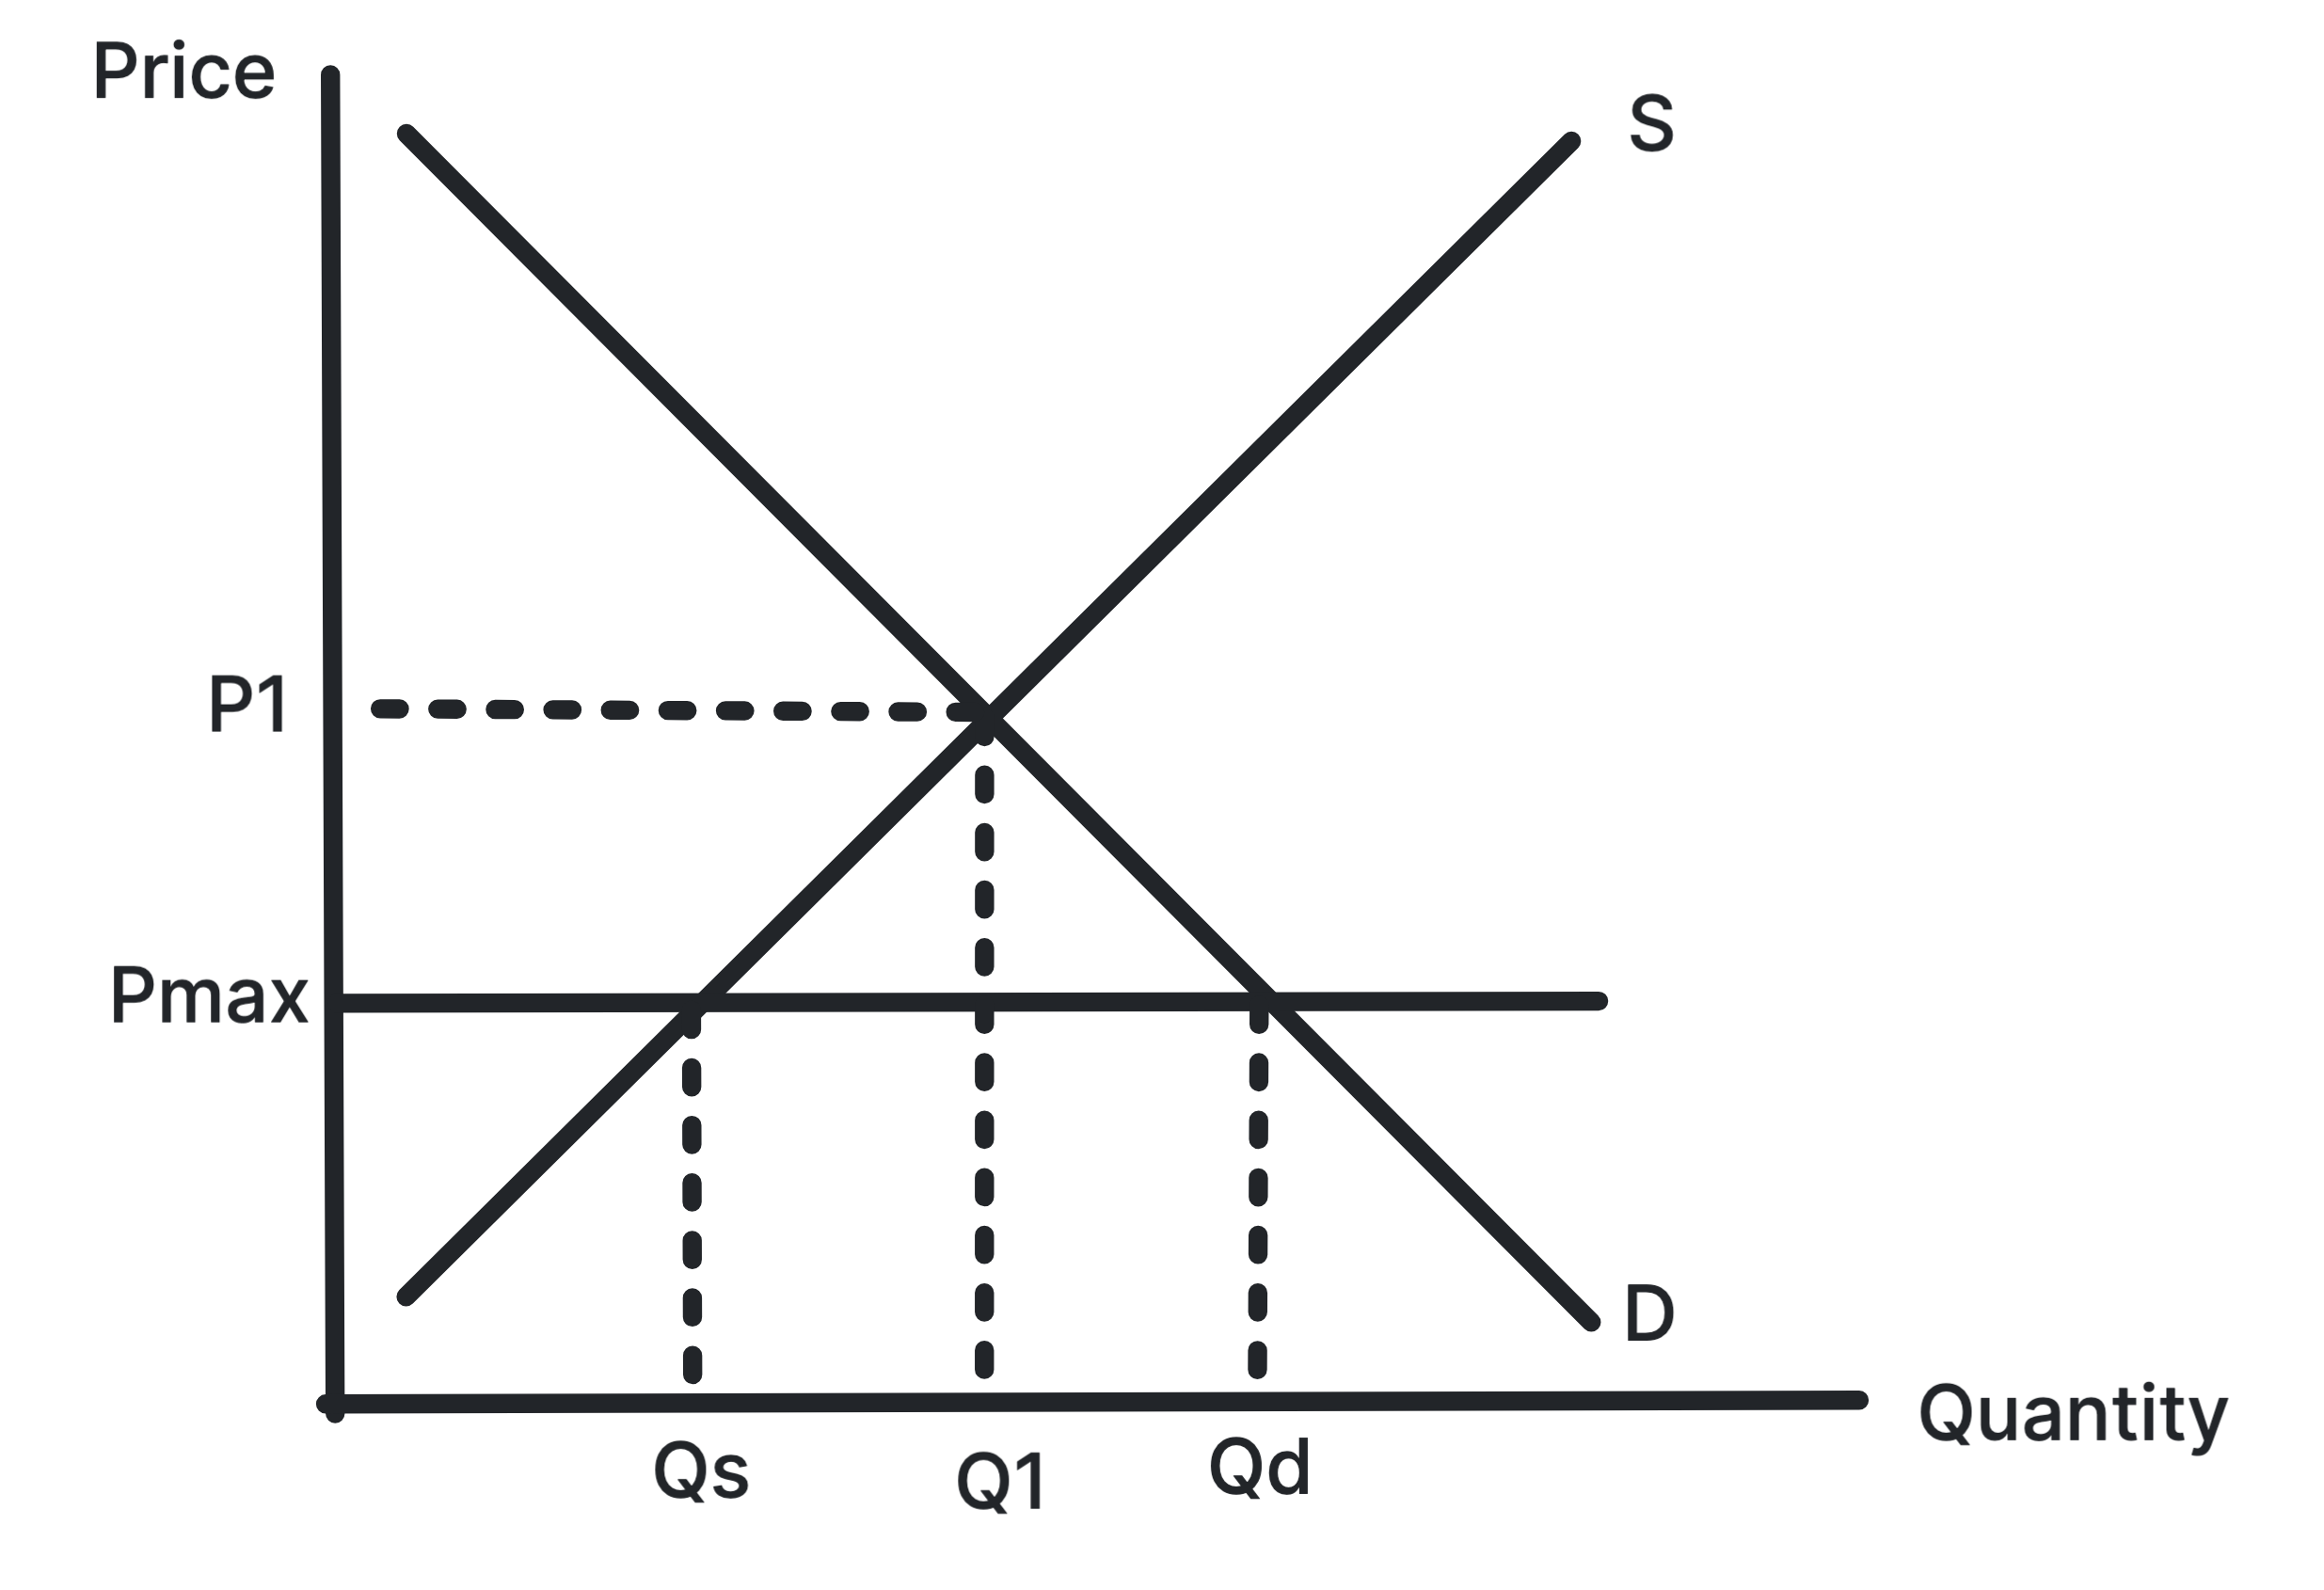
Effect: a legal maximum price set below the equilibrium price. This causes a contraction in supply and an expansion in demand, leading to excess demand in the market.
-
Evaluations:
- Shortages: maximum prices can lead to shortages as quantity demanded exceeds quantity supplied at the set price. This can result in long queues, rationing, and potential black market activity where goods are sold at higher prices.
- Quality reduction: producers may reduce the quality of goods or services to cut costs and maintain profit margins under a maximum price regime. This can lead to a decline in consumer satisfaction and potentially harm public health or safety if quality standards are compromised.
Minimum Prices
Purpose: to guarantee income for producers, such as farmers, or to discourage consumption of demerit goods, such as through alcohol minimum pricing.
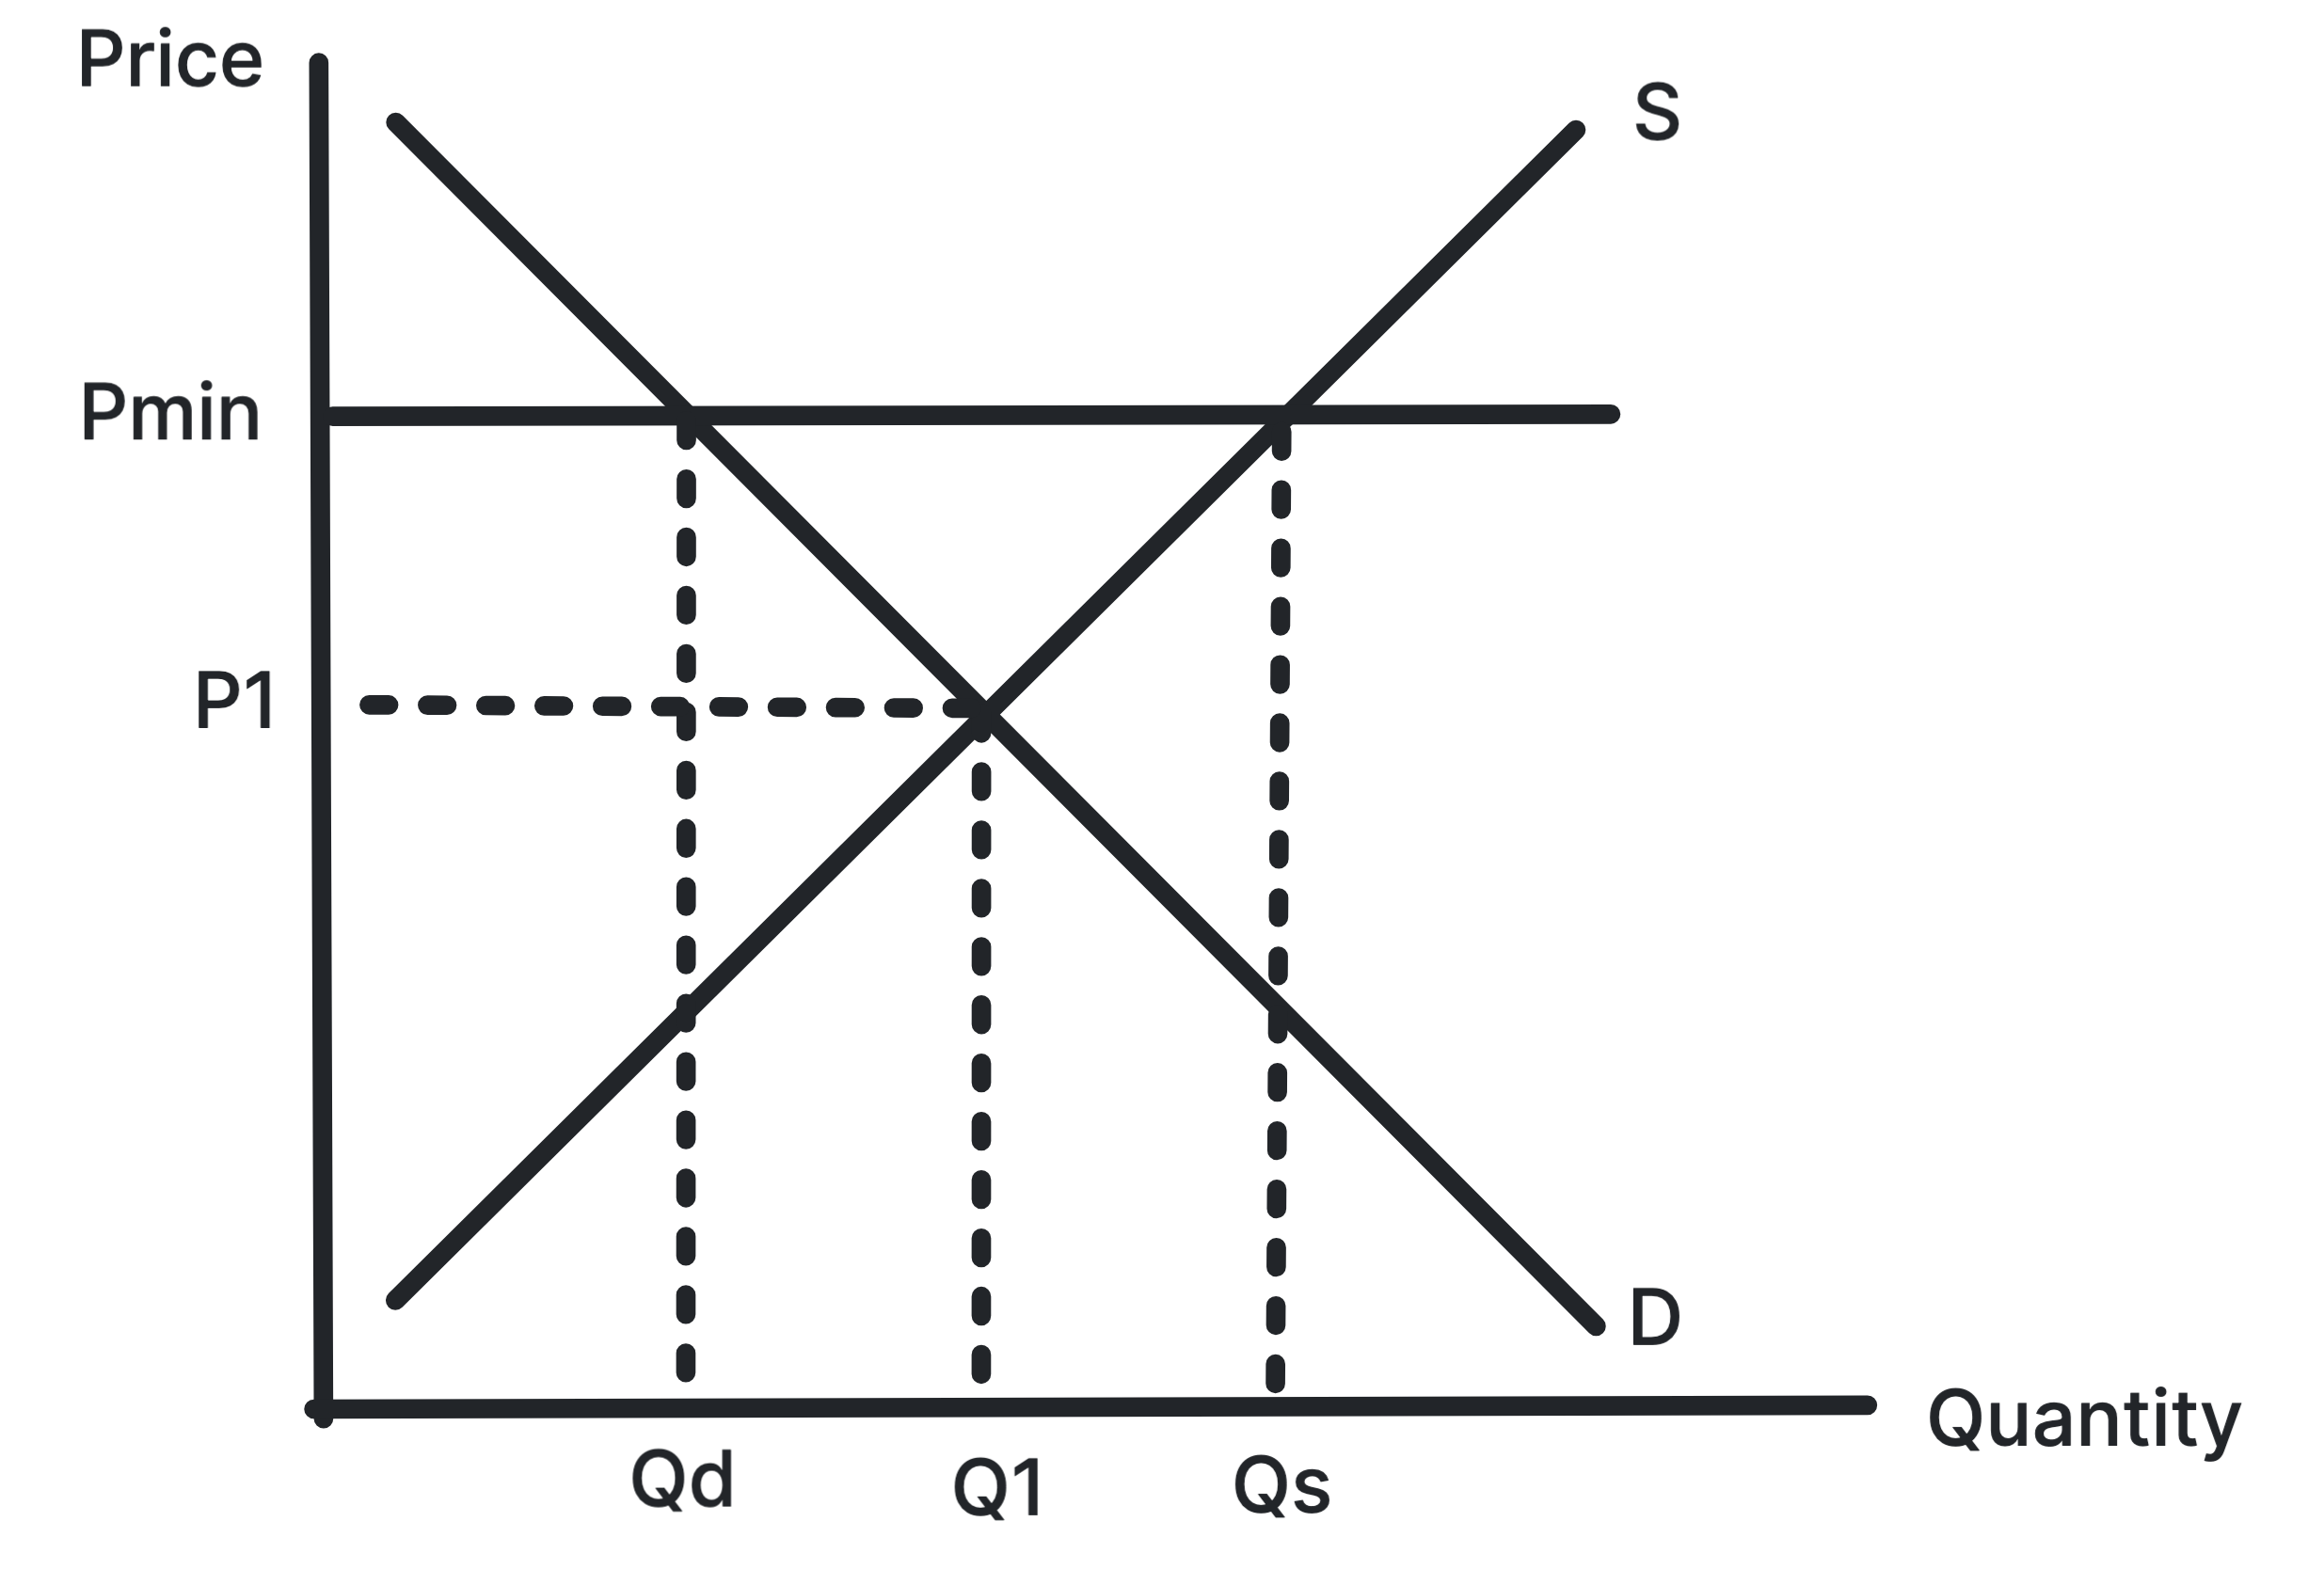
Effect: a legal minimum price set above the equilibrium price. This causes an expansion in supply and a contraction in demand, leading to excess supply in the market.
-
Evaluations:
- Surpluses: minimum prices can lead to surpluses as quantity supplied exceeds quantity demanded at the set price. The government may need to purchase and store the excess supply, which can be costly and may lead to waste if the goods are perishable.
- Black markets: minimum prices can encourage black market activity, where goods are sold illegally at lower prices. This can undermine the effectiveness of the policy and create enforcement challenges for authorities.
Other Intervention Methods
Tradable pollution permits: the government can set a cap on total emissions and auction permits that firms must purchase to emit pollutants. These can then be traded on a secondary market. This increases firms costs of production, resulting in S=MPC shifting upward and internalising the external cost. It also incentivises firms to invest in cleaner technologies.
-
Evaluations
- Enforcement: requires robust monitoring and enforcement to prevent cheating and ensure compliance. This is costly and complex to implement effectively.
- Disadvantages small businesses: smaller firms may struggle to afford permits, leading to firms being driven out of the market and reduced competition.
Government provision: the government can provide merit goods directly, such as public education or healthcare. This ensures that these goods are available to all consumers, regardless of their ability to pay.
-
Evaluations
- Opportunity Cost: government provision can be expensive, and the money could potentially be used more effectively elsewhere.
- Effectiveness: government provision does not ensure that the goods are consumed by those who value them most.
Information provision: the government can provide information about the benefits/costs of certain goods, such as public health campaigns about the importance of vaccinations or the health costs of smoking. This can increase/decrease the D=MPB curve, internalising the externality.
-
Evaluations
- Effectiveness: information campaigns may not be effective if consumers are not receptive to the message or if the advertising is not persuasive enough to change behaviour.
- Opportunity Cost: information campaigns can be costly to implement, and the money could potentially be used more effectively elsewhere.
Regulation and legislation: bans/limits on the production of demerit goods or requiring the consumption of merit goods. This can increase/decrease the S=MPC or D=MPB curve, internalising the externality.
-
Evaluations
- Enforcement costs: regulations can be costly to enforce and may require significant government resources.
- Unintended consequences: strict regulations may lead to black markets or reduced innovation.
Exam Preparation
- Understand the rationale for each type of intervention.
- Draw, label, and analyse the four key diagrams: ad valorem tax, subsidy, maximum price, and minimum price.
- Analyse consequences: always consider the impact on consumers, producers, the government, and society, including shortages, surpluses, welfare loss, revenue, and cost.
- Evaluate effectiveness: for taxes and subsidies, consider PED. For maximum and minimum prices, discuss unintended consequences such as black markets or the cost of buying surpluses.
- Link interventions to market failure: explain how a tax corrects a negative externality or how a subsidy corrects a positive externality.