Indirect Taxes and Subsidies
These Edexcel A-Level Economics revision notes cover unit 1.2.9, explaining how indirect taxes and subsidies shift the supply curve, how the tax burden is shared between consumers and producers depending on price elasticity of demand, and how to analyse their welfare effects.
Indirect Taxes
Definition: A tax levied on goods and services when they are purchased, such as VAT or sugar tax. It is paid indirectly by the consumer via the producer, so affects the supply curve rather than the demand curve.
Types of Indirect Tax:
- Specific tax: A fixed amount of tax per unit sold, e.g. £0.50 per pack of cigarettes.
- Ad valorem tax: A percentage of the price, e.g. 20% VAT on most goods and services.
Purpose: To raise government revenue and/or to discourage consumption of demerit goods, such as cigarettes or sugary products.
Impact on Supply: An indirect tax increases a firm's costs of production. This is shown by a leftward (upward) shift of the supply curve.
Analysing a Specific (Per-Unit) Tax
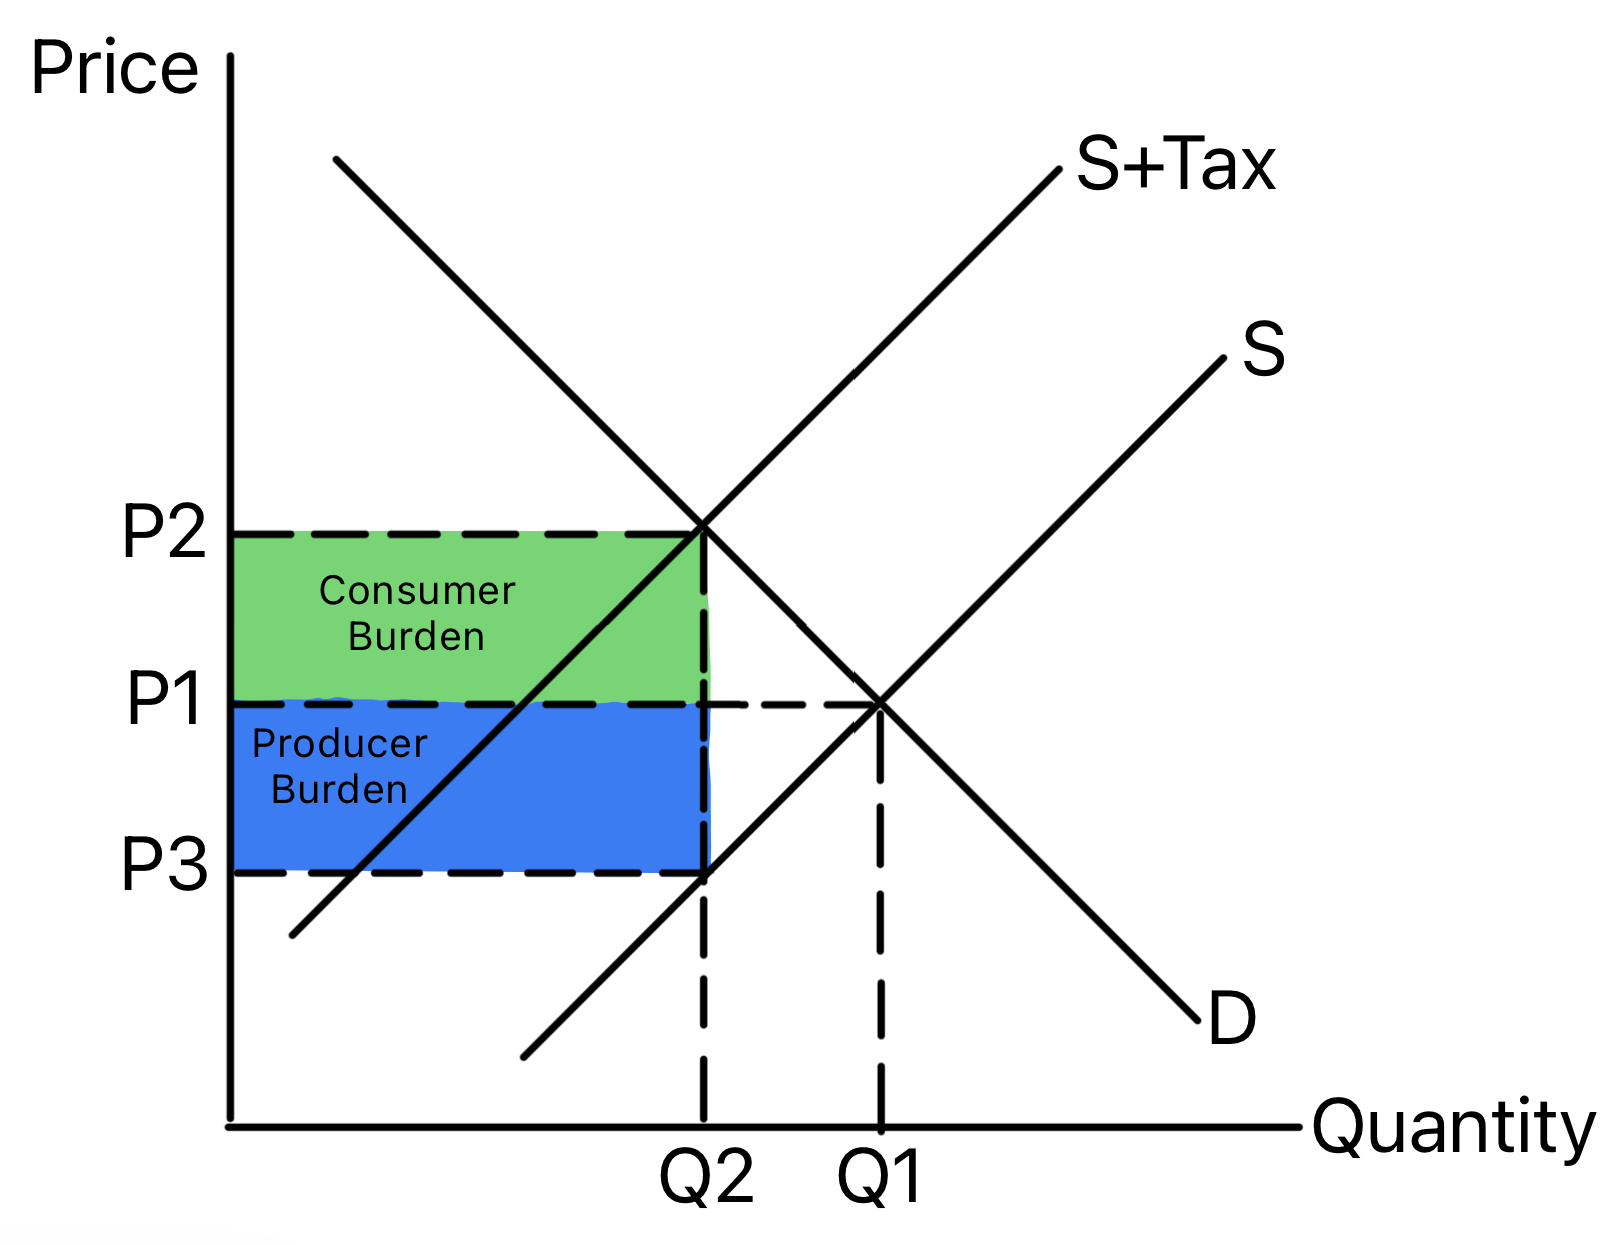
- The Shift: Supply shifts left from S to S+Tax.
- The vertical distance between S and S+Tax equals the tax per unit.
New Equilibrium
- Consumer price rises from P1 to P2.
- Quantity falls from Q1 to Q2.
Tax Incidence
- Consumer incidence: (P2 - P1) x Q2. This is the portion of the tax paid by consumers via the higher price. Represented by the green area.
- Producer incidence: (P1 - P3) x Q2. This is the portion of the tax paid by producers via lower revenue. Represented by the blue area.
- Government revenue: Total tax x Q2 = (P2 - P3) x Q2. This is the sum of consumer and producer incidence.
The Role of Price Elasticity of Demand (PED)
The relative burden, or incidence, of a tax depends on the PED of the product.
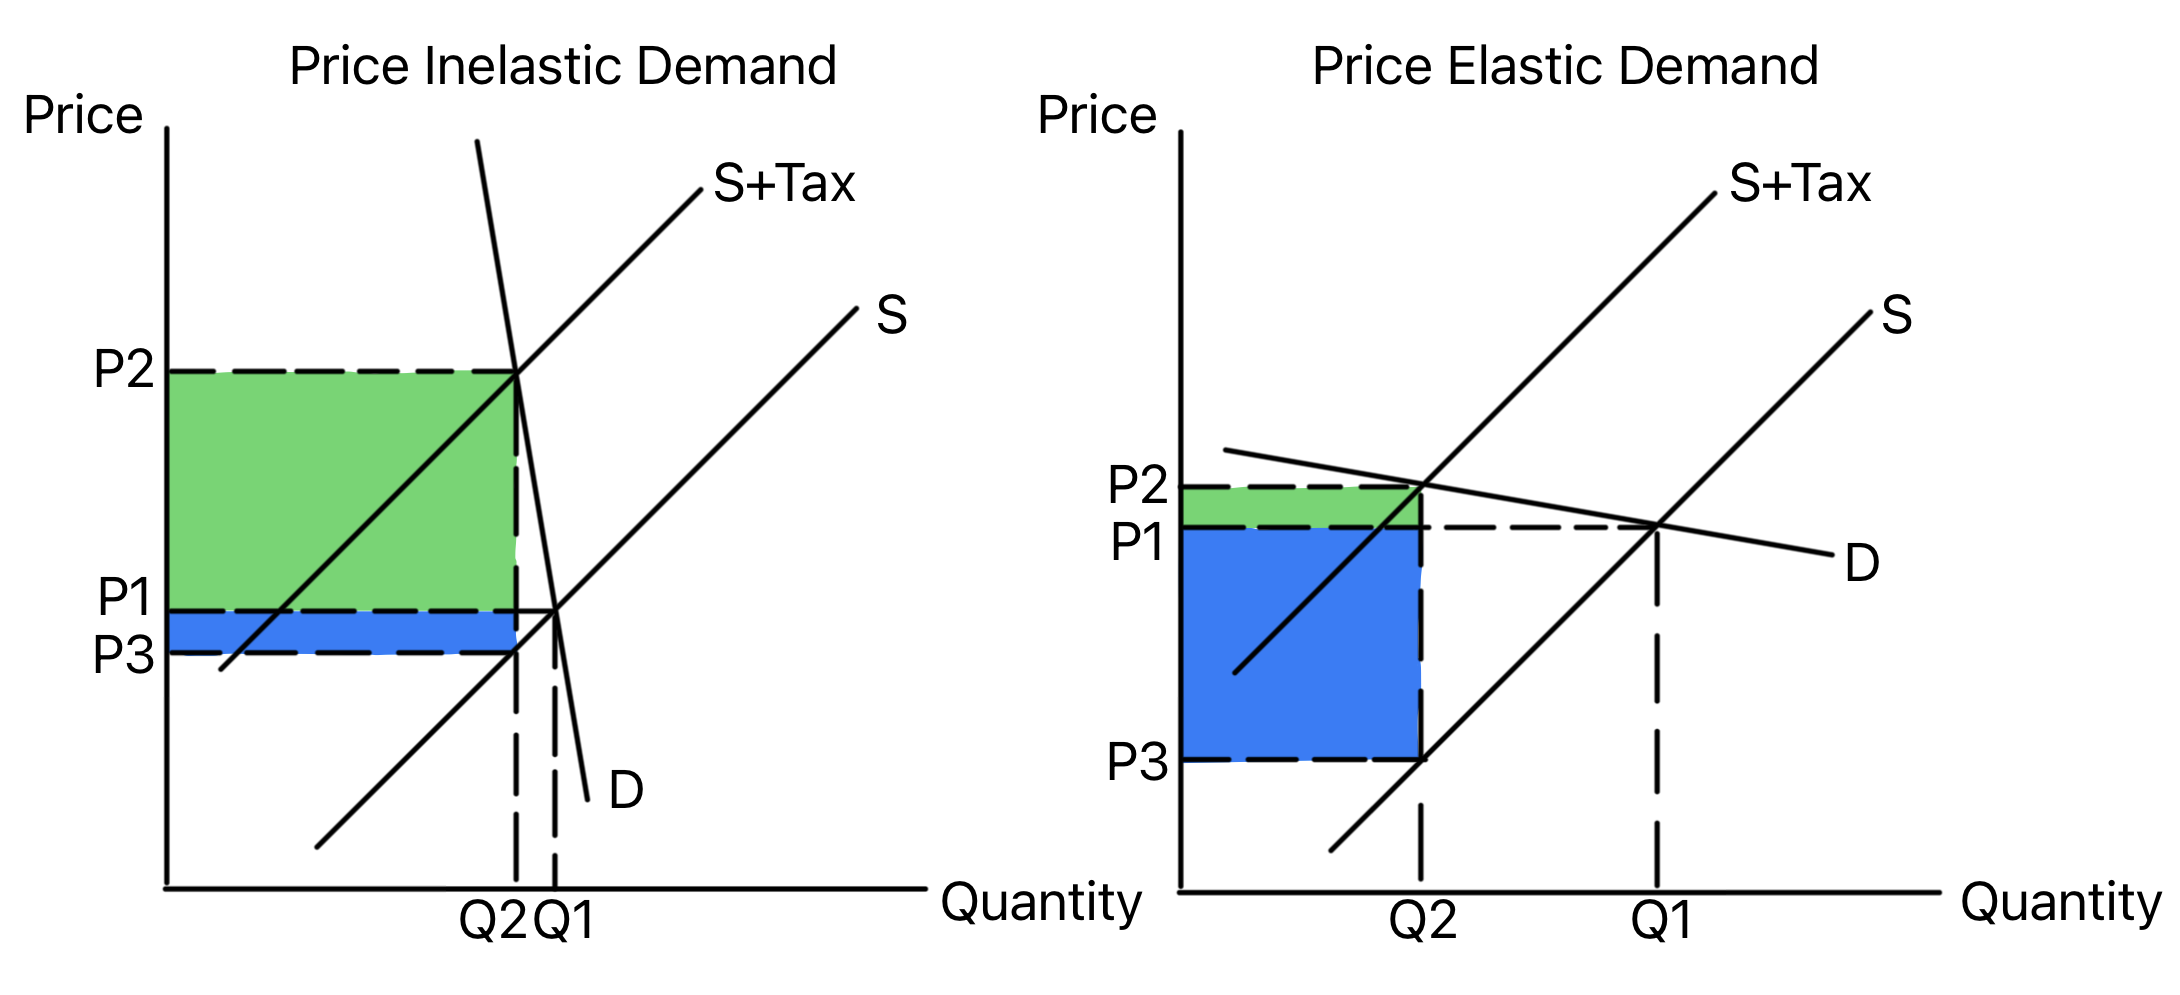
| Demand is Price Inelastic | Demand is Price Elastic |
|---|---|
|
|
Subsidies
Definition: A per-unit payment from the government to producers to lower their costs of production.
Purpose: To encourage production and consumption of merit goods, such as solar panels or education, or to support key industries.
Impact on Supply: A subsidy lowers a firm's costs of production. This is shown by a rightward (outward) shift of the supply curve.
Analysing a Subsidy
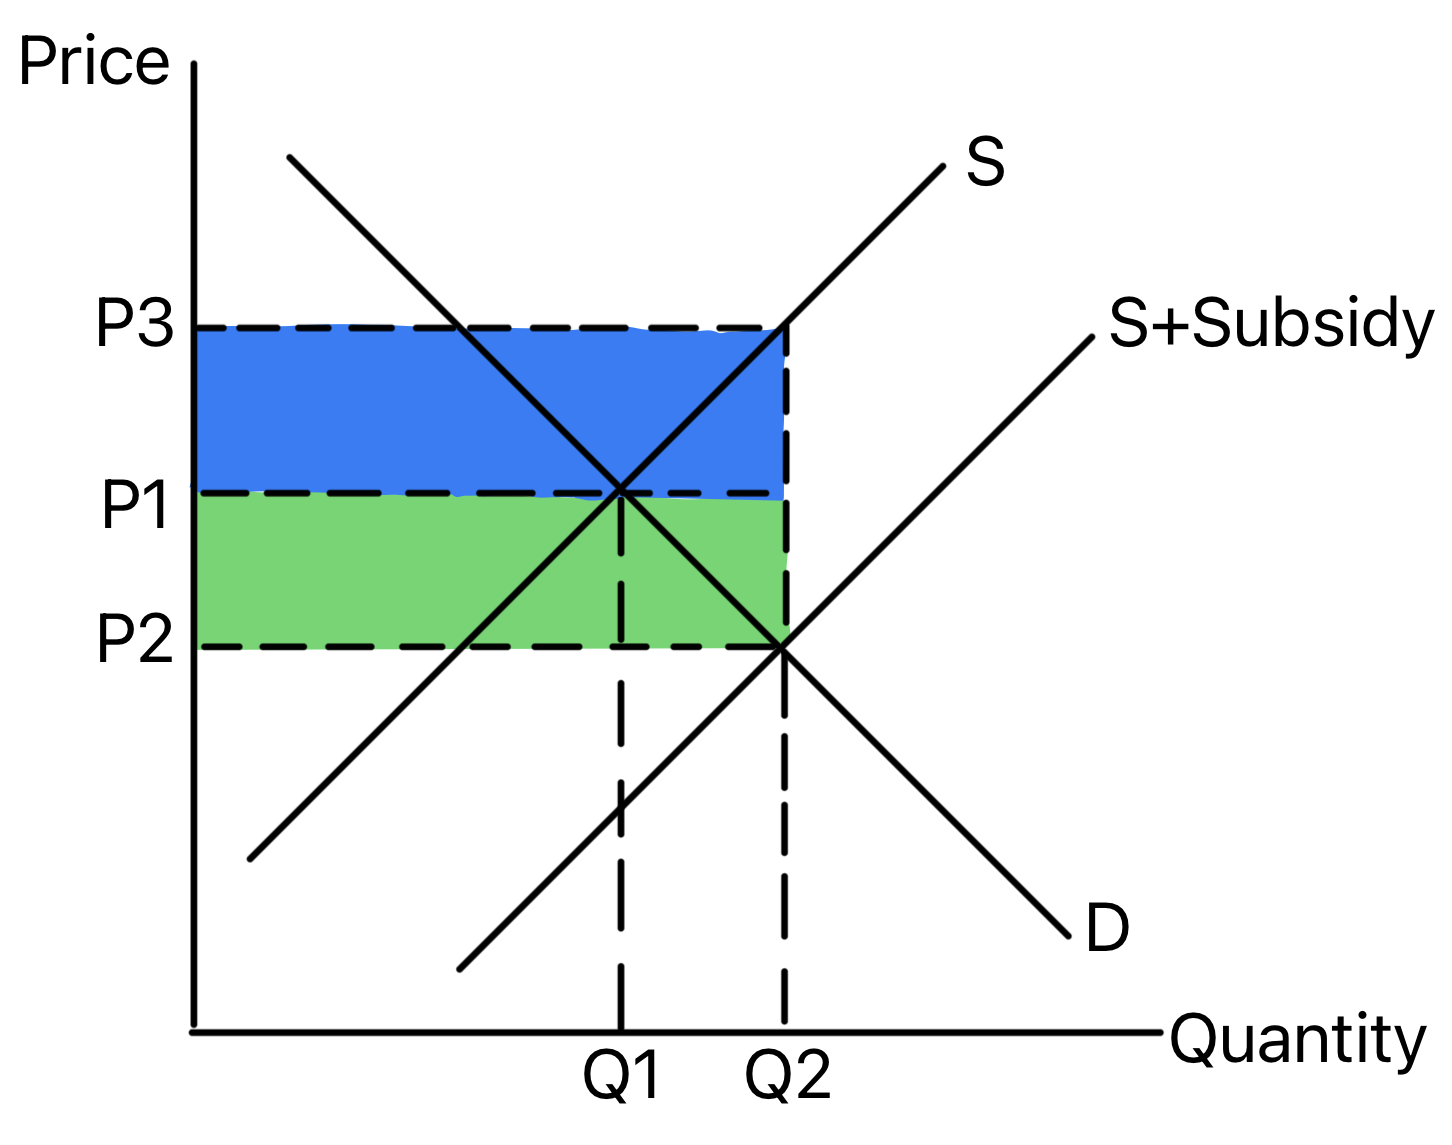
- The Shift: Supply shifts right from S to S+Subsidy.
- The vertical distance between S and S+Subsidy equals the subsidy per unit.
New Equilibrium
- Consumer price falls from P1 to P2.
- Quantity rises from Q1 to Q2.
Subsidy Incidence
- Consumer incidence: (P1 - P2) x Q2. This is the benefit to consumers from the lower price.
- Producer incidence: (P3 - P1) x Q2. This is the benefit to producers from higher revenue per unit.
- Government cost: Total subsidy x Q2 = (P3 - P2) x Q2. This is the total expenditure by the government.
Exam Focus
- Draw accurate diagrams for both a specific tax and a subsidy, labelling all key prices, quantities, and areas of incidence or government revenue/cost.
- Explain clearly that taxes shift supply left while subsidies shift supply right.
- Analyse the impact on consumers, producers, and the government.
- Evaluate using PED: A tax on an inelastic good raises more revenue but reduces consumption less.
- Link policy to aims: Whether a tax or subsidy is effective depends on the objective, such as reducing consumption, encouraging consumption, or raising revenue.