Supply
These Edexcel A-Level Economics revision notes cover unit 1.2.4, explaining the law of supply, what causes the supply curve to shift, and how factors like input costs, technology, and taxation affect producers' willingness to supply.
The Basics of Supply
Supply: The quantity of a good/service producers are willing and able to produce/sell at a given price in a given time period.
The Law of Supply: There is a positive relationship between price and quantity supplied (QS). As price rises, QS rises (ceteris paribus).
Reason: Higher prices increase potential profit margins, giving firms an incentive to increase output.
The Supply Curve
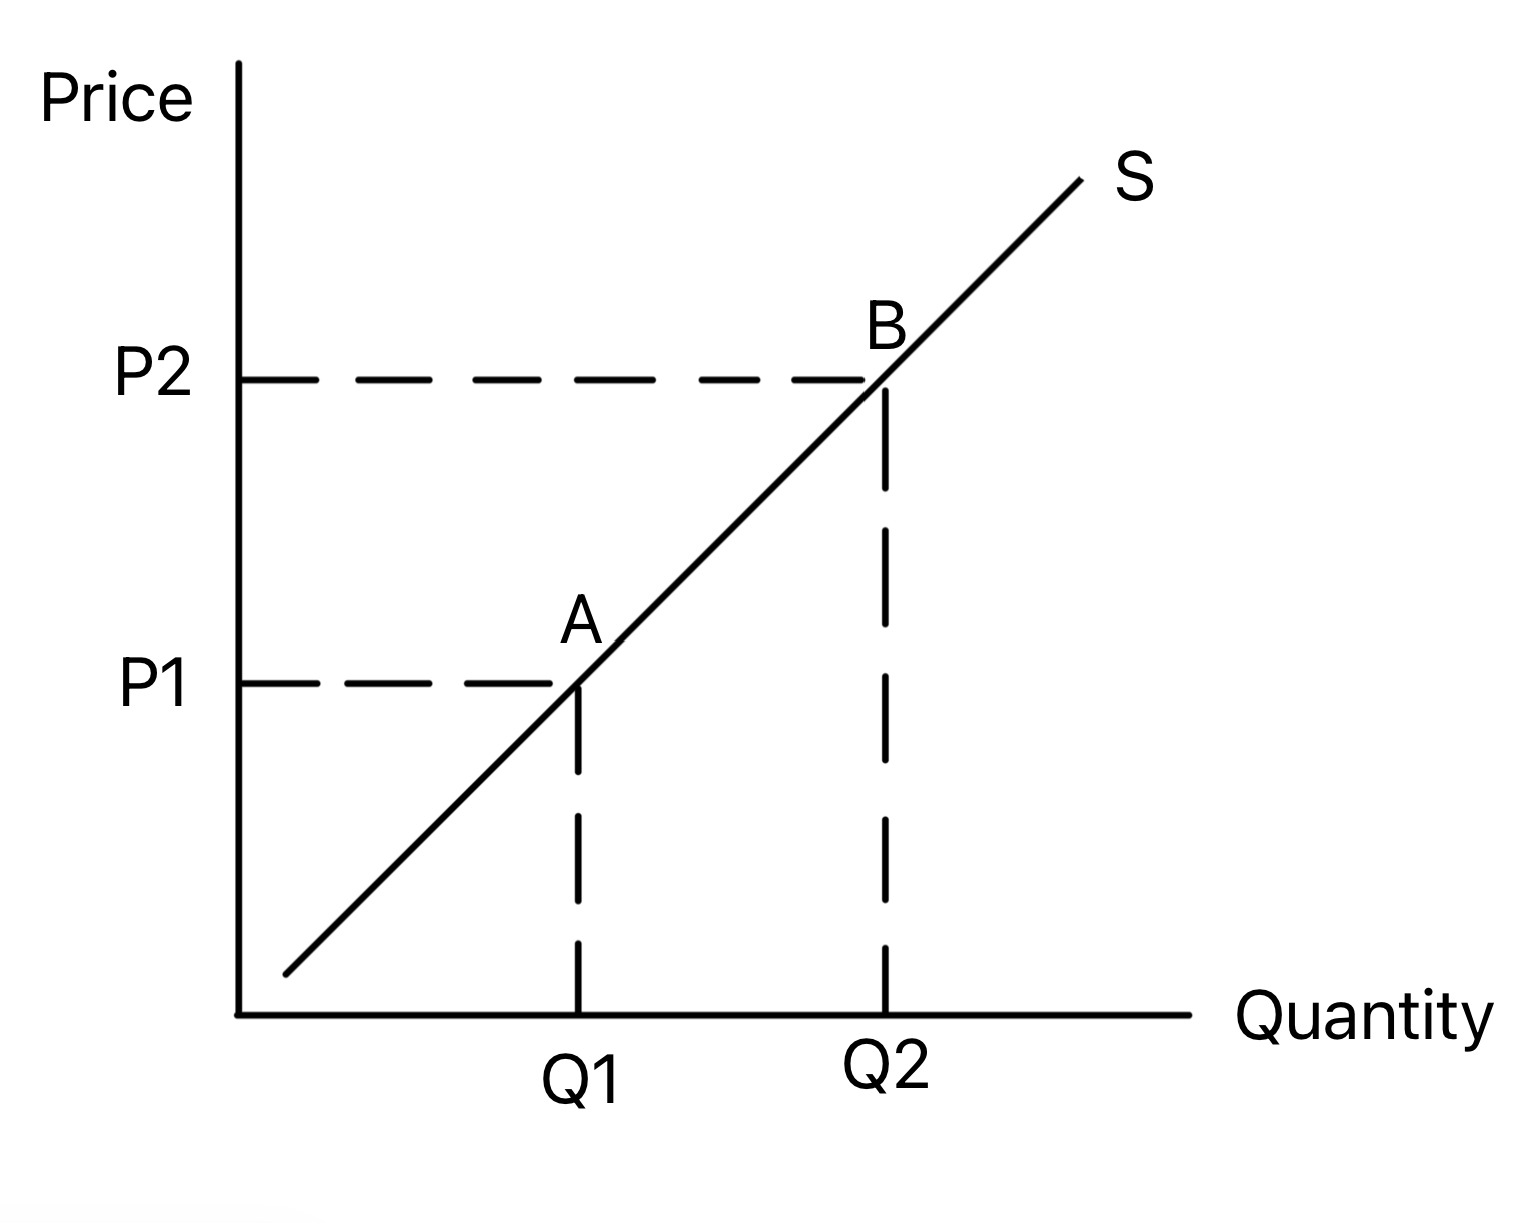
It is upward sloping due to the law of supply.
A Movement Along the Curve: Caused only by a change in the price of the good itself (ceteris paribus).
- Extension in QS: A rise in price leads to a movement up the curve (A → B).
- Contraction in QS: A fall in price leads to a movement down the curve (A → C).
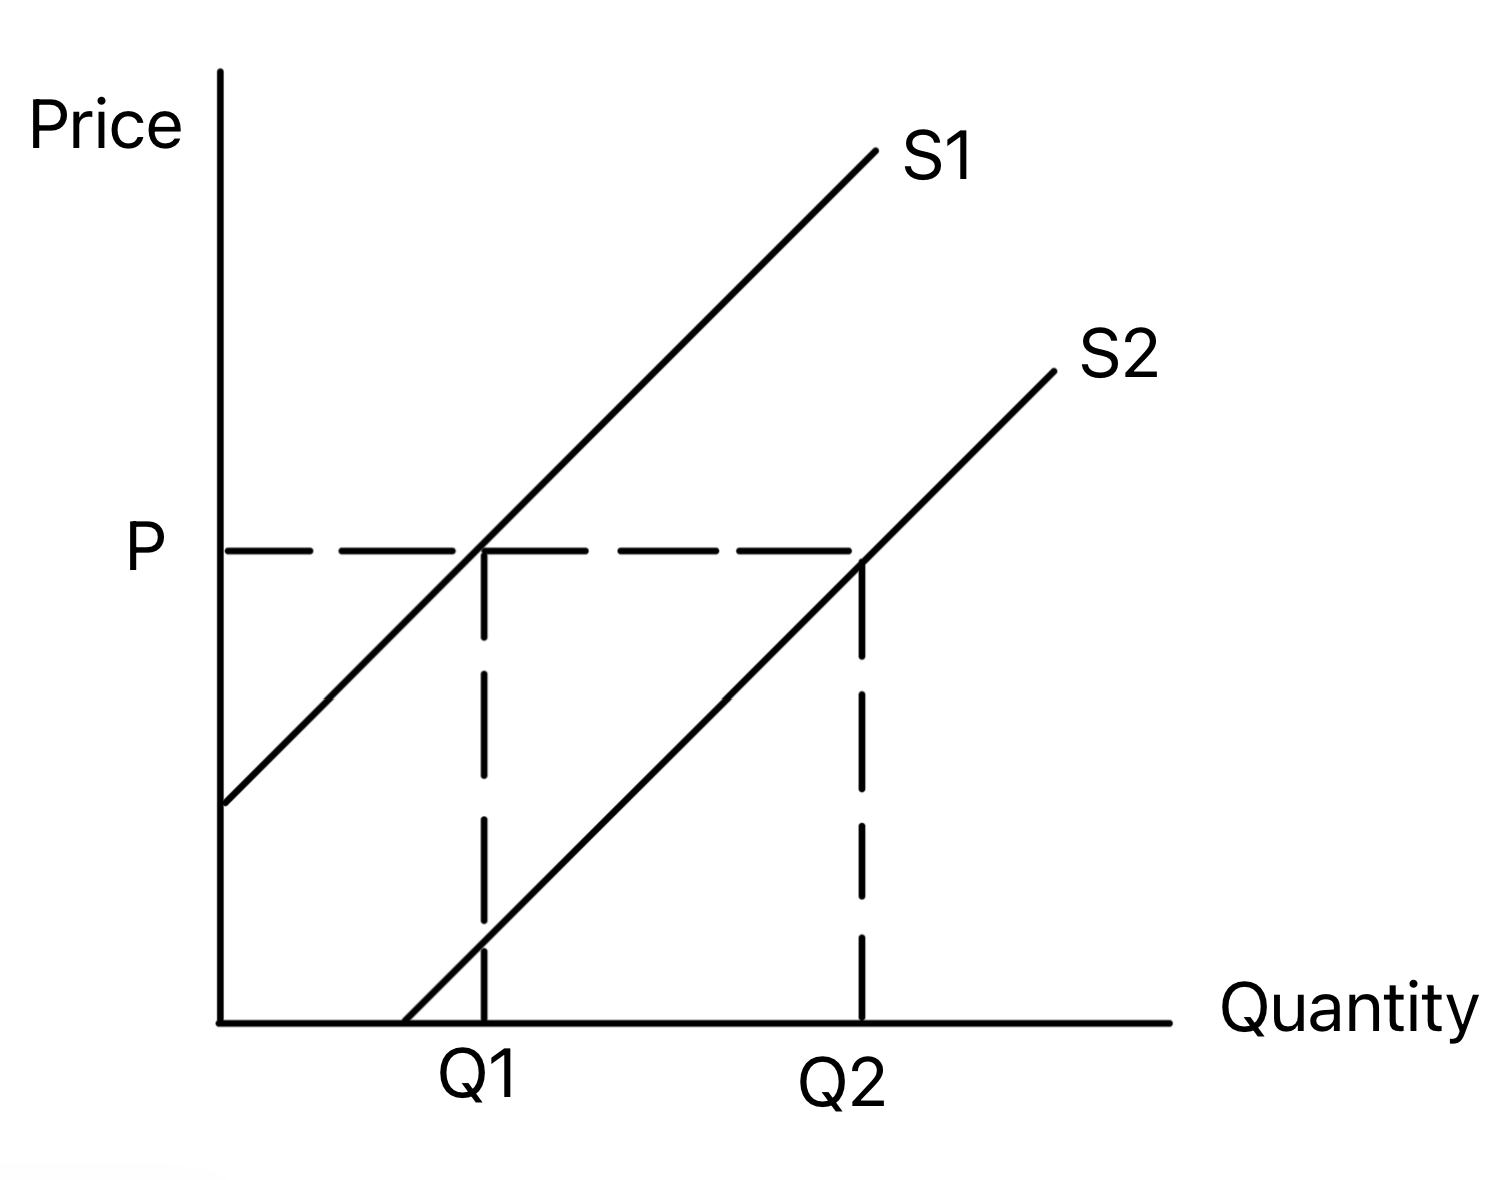
Conditions of Supply (Shifts of the Curve)
A shift of the entire supply curve is caused by a change in a non-price factor influencing a firm's costs or production capacity.
| Condition of Supply | Effect on Supply | Reason & Example |
|---|---|---|
| Changes in Costs of Production (e.g., raw materials, wages, rent) |
Costs ↑ = Supply ↓ (shift left) Costs ↓ = Supply ↑ (shift right) |
Higher costs reduce profitability at each price, so less is supplied. |
| Introduction/Change in Indirect Taxes (e.g., VAT, sugar tax) |
Tax ↑ = Supply ↓ (shift left) Tax ↓ = Supply ↑ (shift right) |
Taxes increase a firm's costs, effectively reducing supply. |
| Introduction/Change in Subsidies (government grants to producers) |
Subsidy ↑ = Supply ↑ (shift right) Subsidy ↓ = Supply ↓ (shift left) |
Subsidies lower a firm's costs, increasing profitability and supply. |
| Technological Advances | Tech. ↑ = Supply ↑ (shift right) | New technology improves productivity and lowers average costs. |
| Change in Number of Firms in the Market |
Firms ↑ = Supply ↑ (shift right) Firms ↓ = Supply ↓ (shift left) |
More firms in the industry increases total market supply. |
| External Shocks (e.g., natural disasters, geopolitical events) |
Positive external shocks = Supply ↑ (shift right) Negative external shocks = Supply ↓ (shift left) |
Events like natural disasters can disrupt production (negative shock). |
Exam Preparation
- Distinguish clearly between a movement along the supply curve (caused by price change) and a shift of the curve (caused by a condition of supply).
- Draw and interpret supply curve diagrams showing both movements and shifts.
- Analyse how each condition of supply causes an increase (shift right) or decrease (shift left).
- Link conditions of supply directly to changes in a firm's costs of production.
- Understand that taxes and subsidies are government interventions that directly shift the supply curve by altering producers' costs.