Demand
These Edexcel A-Level Economics revision notes cover unit 1.2.2, explaining the law of demand, the factors that shift the demand curve, and how diminishing marginal utility underpins the inverse relationship between price and quantity demanded.
The Basics of Demand
Definition: The quantity of a good/service consumers are willing and able to buy at a given price in a given time period.
Effective Demand: Must be both a willingness and an ability to pay. Desire alone is not demand.
The Law of Demand: There is an inverse relationship between price and quantity demanded (QD). As price rises, QD falls (ceteris paribus).
The Demand Curve
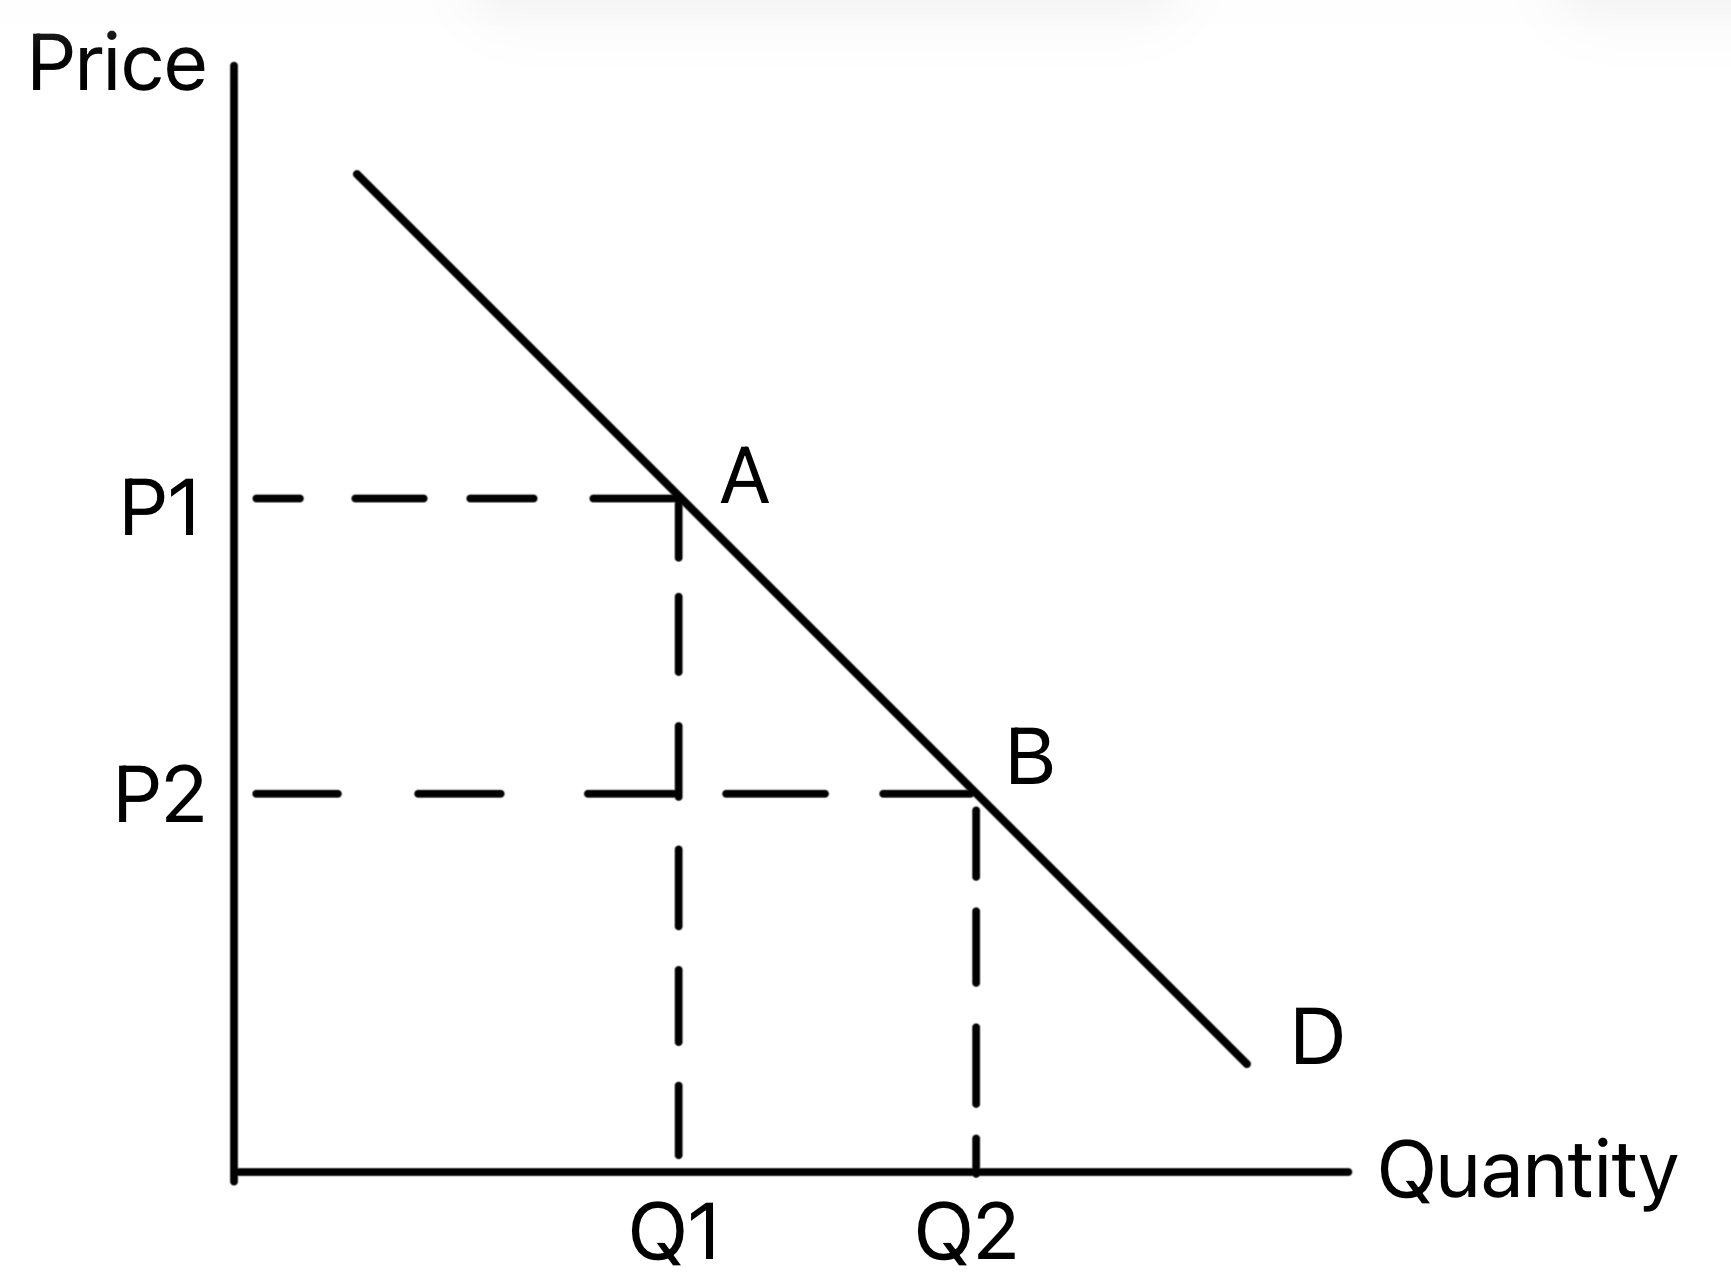
It is downward sloping due to the law of demand.
A Movement Along the Curve: Caused only by a change in the price of the good itself (ceteris paribus).
- Extension in QD: A fall in price leads to a movement down the curve (A → B).
- Contraction in QD: A rise in price leads to a movement up the curve (B → A).
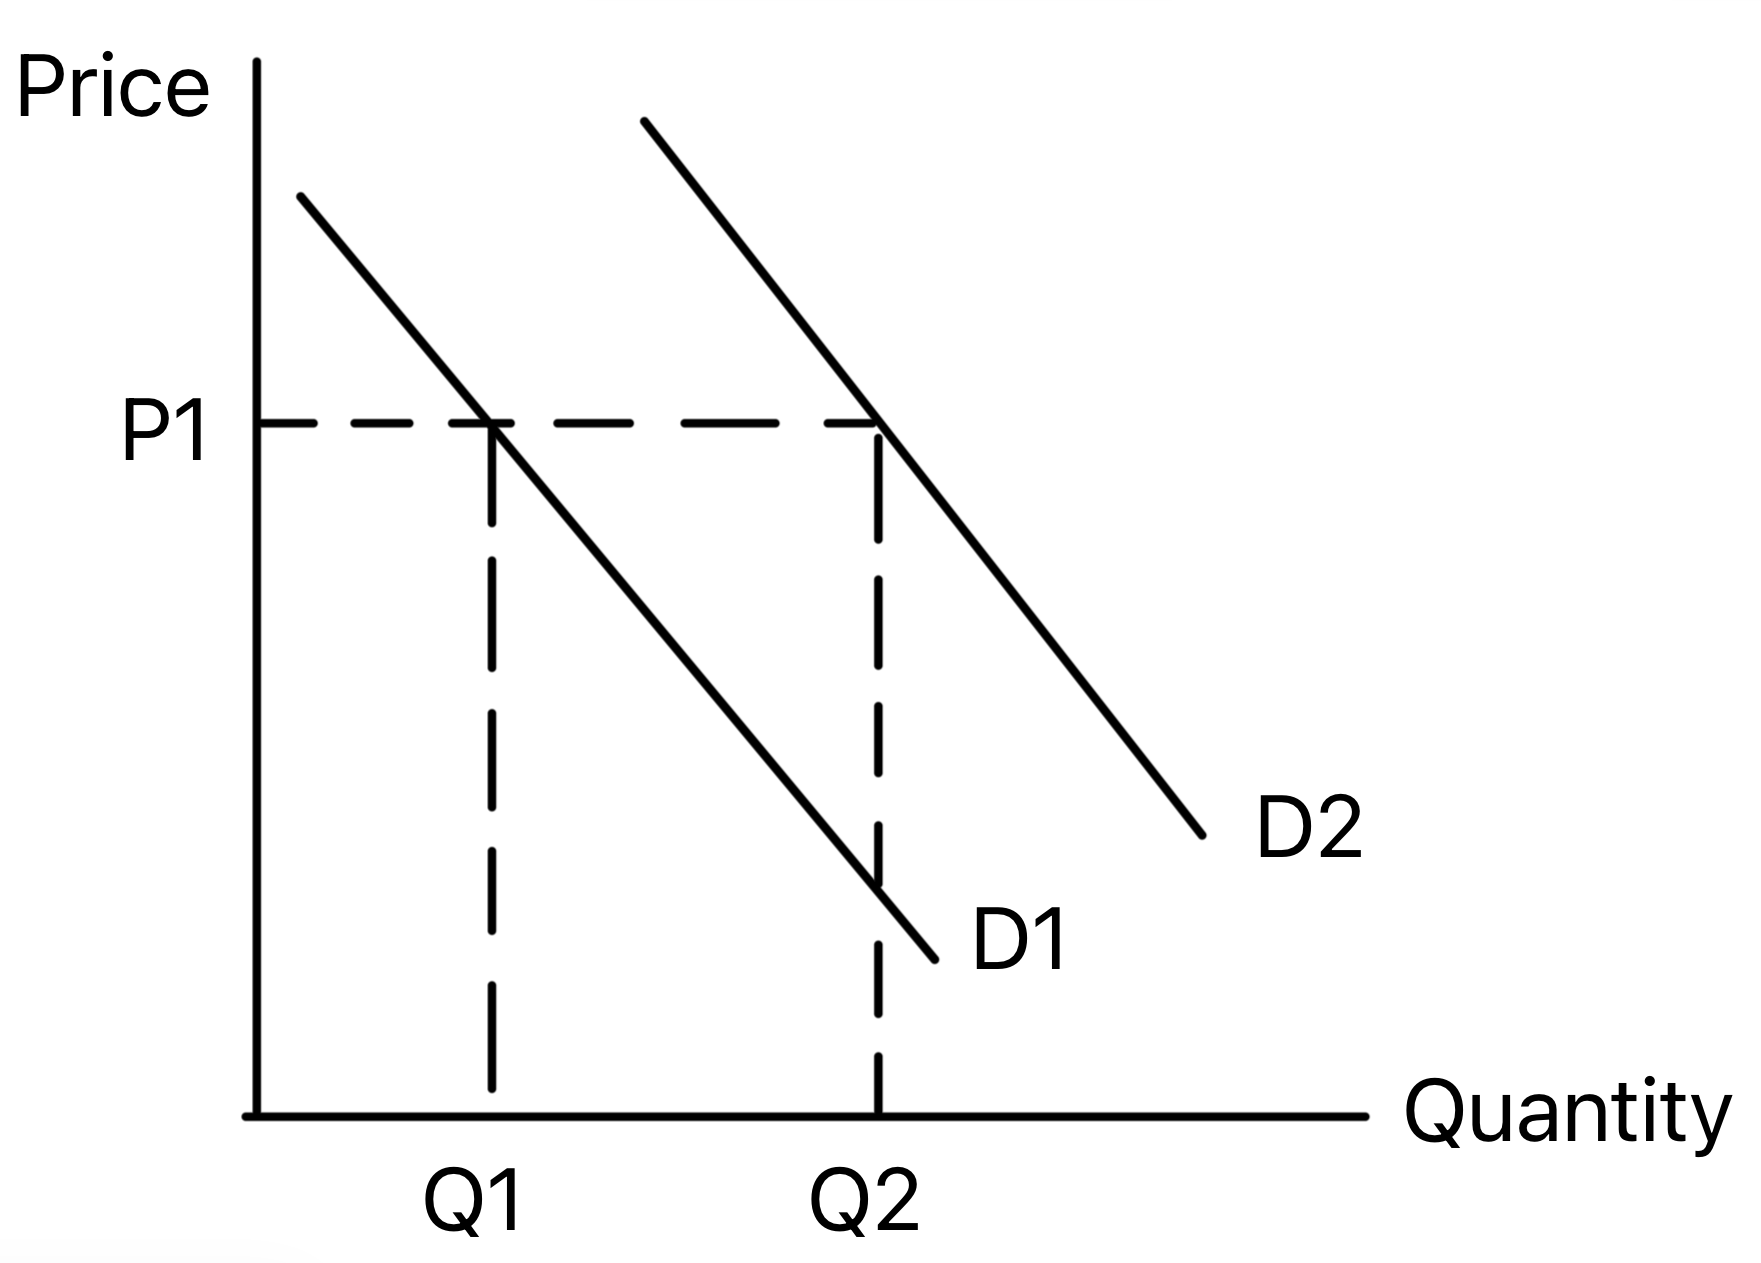
Conditions of Demand (Shifts of the Curve)
A shift of the entire demand curve is caused by a change in a non-price factor influencing demand.
| Condition of Demand | Effect on Demand for Good X | Reason & Example |
|---|---|---|
| Change in Real Incomes |
Normal Good: D ↑ if incomes rise. Inferior Good: D ↓ if incomes rise. |
Direct relationship for normal goods (e.g., restaurant meals). Inverse for inferior goods (e.g., own-brand value products). |
| Change in Tastes/Fashion | D ↑ if the good becomes more popular. | Direct relationship (e.g., surge in demand for a trending product). |
| Advertising & Branding | D ↑ with successful marketing. | Increases consumer awareness and perceived value. |
| Price of Substitutes | D for Good X ↑ if price of Substitute Y rises. | Direct relationship (e.g., price of Coke rises → demand for Pepsi increases). |
| Price of Complements | D for Good X ↓ if price of Complement Z rises. | Inverse relationship (e.g., price of petrol rises → demand for cars decreases). |
| Changes in Population | D ↑ if population size or a key demographic grows. | More potential consumers (e.g., ageing population increases demand for healthcare). |
Diminishing Marginal Utility & Demand
Marginal Utility (MU): The extra satisfaction from consuming one more unit.
The Law of Diminishing Marginal Utility: As more units are consumed, the extra utility gained from the next unit falls.
Example: The first slice of pizza gives high satisfaction, the fourth gives much less.
Link to the Demand Curve: This law helps explain why the demand curve slopes down.
Because each additional unit gives less satisfaction, a consumer is only willing to buy more if the price is lower. This rationalises the inverse price-QD relationship.
Exam Preparation
- Distinguish clearly between a movement along the demand curve (caused by price change) and a shift of the curve (caused by a condition of demand).
- Draw and interpret demand curve diagrams showing both movements and shifts.
- Analyse how each condition of demand causes an increase (shift right) or decrease (shift left).
- Apply the concepts of substitutes and complements.
- Explain how the law of diminishing marginal utility underpins the shape of the demand curve.