Production Possibility Frontiers
These Edexcel A-Level Economics revision notes cover unit 1.1.4, showing you how to draw, interpret, and analyse production possibility frontier diagrams to illustrate scarcity, opportunity cost, productive efficiency, and economic growth.
What a PPF Shows
Production Possibility Frontier:A curve that shows the maximum potential output combinations of two goods or services an economy can achieve when all its resources are fully and efficiently employed.
The two goods on the axes are often capital goods (e.g., machinery, tools - used for future production) and consumer goods (e.g., phones, food - for immediate consumption).
PPFs can also be used to show trade-offs between any two types of goods or services (e.g., healthcare vs education, or t-shirts vs butter). If unspecified, assume the standard capital vs consumer goods model.
Key Points on the Diagram
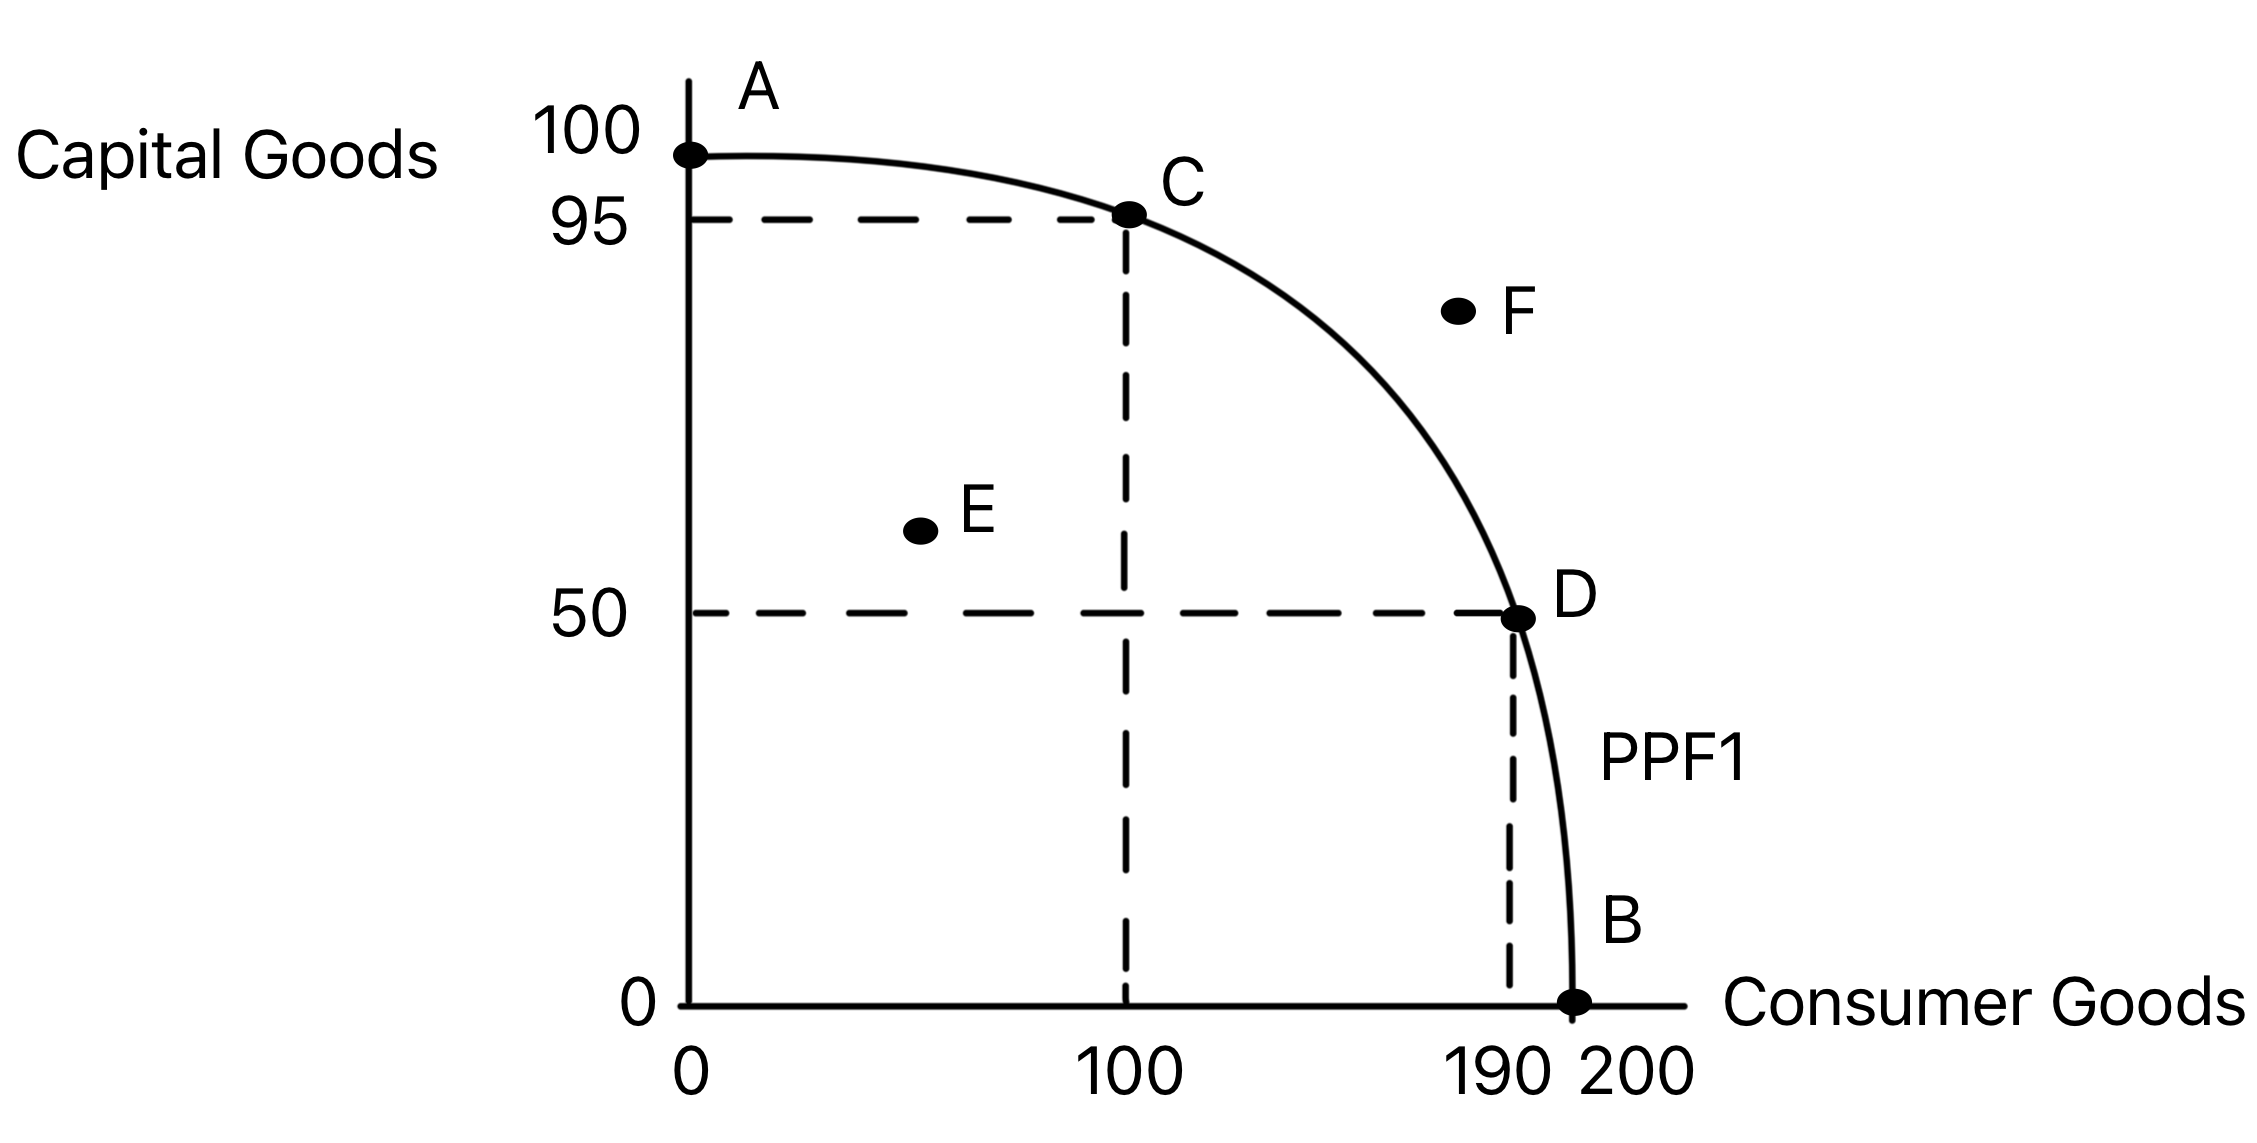
- Points on the curve (A, B, C, D) represent productively efficient output combinations. All resources are fully and efficiently used.
- Points inside the curve (e.g., E) represent productive inefficiency and unemployed resources. The economy could produce more of both goods at zero opportunity cost.
- Points outside the curve (e.g., F) are currently unattainable with the existing resources and technology.
Opportunity Cost and the PPF
The PPF visually demonstrates opportunity cost.
- The curve is bowed outward (concave to the origin) because not all resources are perfectly adaptable between different uses. This illustrates the concept of increasing opportunity cost.
- Marginal Analysis: A movement along the curve (e.g., from C to D) shows the opportunity cost of producing more of one good. To produce more consumer goods, the economy must sacrifice producing some capital goods.
- For example: The opportunity cost of moving from point A to point C is the loss of 5 capital goods.
- Opportunity cost can also be expressed at a singular point on the curve. For example, the opportunity cost of producing at point A is 200 consumer goods.
Shifts in the PPF: Economic Growth & Decline
A movement along the curve is caused by reallocating existing resources. A shift of the entire curve is caused by a change in the economy's productive potential.
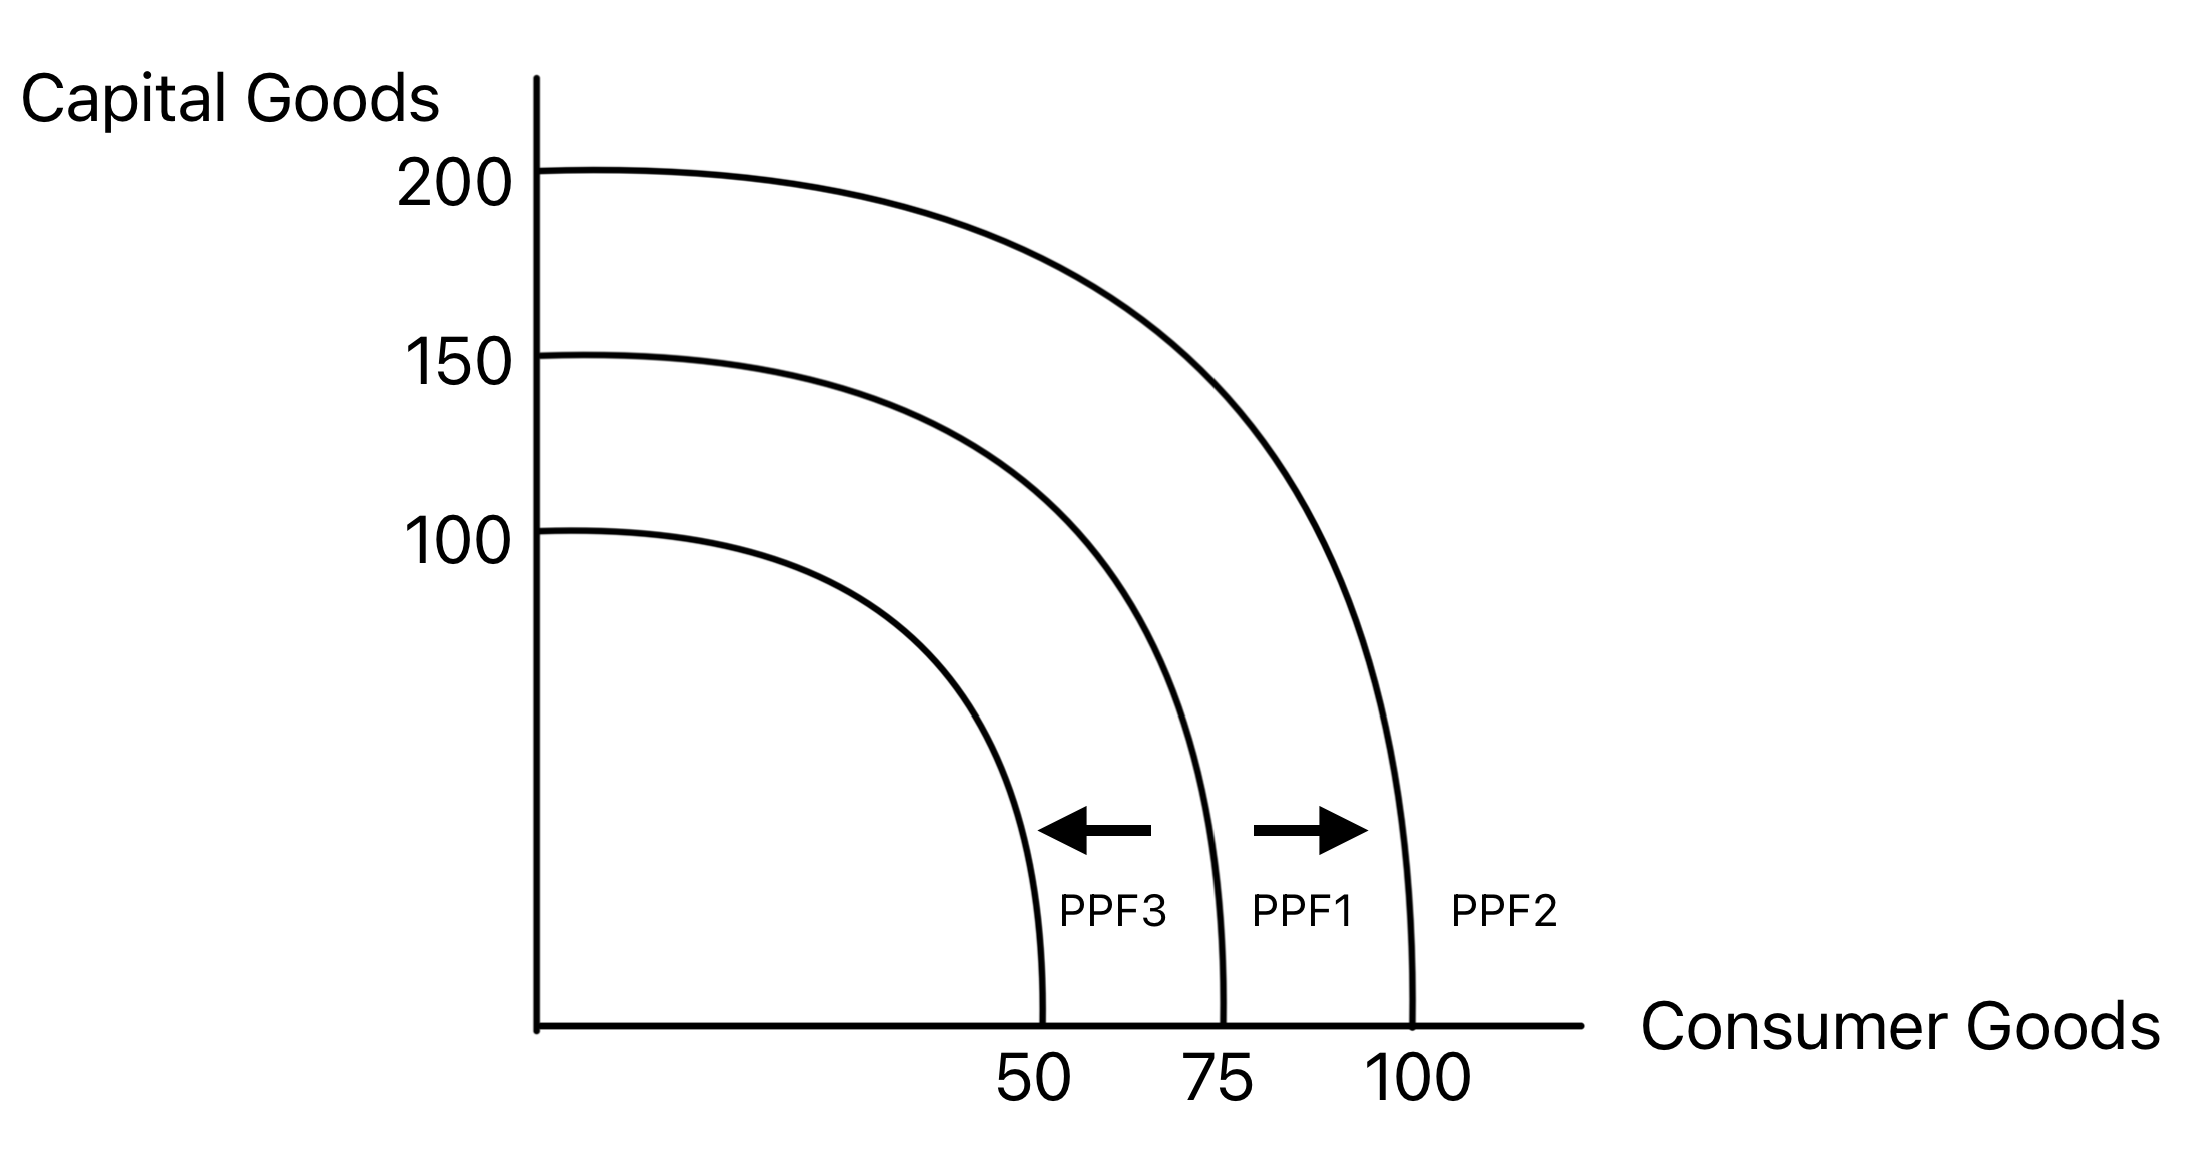
- Increase in quantity of factors of production (e.g., more labour through immigration, discovery of new raw materials).
- Improvement in quality of factors of production (e.g., better education/training, technological advancements).
Inward Shift (←): Represents economic decline (a reduction in productive potential). Causes:
- Natural disasters (e.g., tsunami destroying capital).
- War or conflict.
- Widespread long-term unemployment that causes skills to deteriorate ('scarring').
Exam Preparation
- Draw and label a PPF diagram accurately, including shifts.
- Explain what points on, inside, and outside the curve represent.
- Calculate the opportunity cost of moving between two points on the curve.
- Analyse the causes and consequences of outward and inward shifts in the PPF.
- Evaluate the trade-off between capital and consumer goods. An economy that chooses a point with more capital goods may grow faster in the future, shifting its PPF outwards more than an economy that prioritises immediate consumer goods.